Water Quality Monitoring of Province Lake
Effingham & Wakefield, New Hampshire, and Parsonsfield, Maine
2012 Supplemental Report - Published Online July 18, 2013
- Q & A on Meaning of Impairments -
In order to get a better understanding about what it means for Province Lake to be "Impaired" on various official lists, I sent a rather lengthy letter to Sally Soule, the New Hampshire Department of Environmental Services (NH DES) official who is working on the Province Lake Watershed Management Plan. She graciously agreed to provide a full and thoughtful response, and has done so. She worked with DES staff Ken Edwardson, Surface Water Quality Assessment Program, and Sara Steiner, Volunteer Lake Assessment Program (VLAP), to provide answers to the questions in my June 18 letter to her.
The tables below provide my questions, the DES answers, and any concluding comments I have. Questions and answers are edited for clarity. Click on this menu to jump to the subject you are interested in:
- Mercury in Fish
- Cyanobacteria Hepatotoxic
- Dissolved Oxygen Concentration
- pH
- Ideal pH for Fish
- Chlorophyll-a
- Phosphorus (and more on Chlorophyll-a)
- Trophic Classifications
- Terms of Use
| Question | 1. Mercury in fish: All lakes in New Hampshire are listed as impaired due to atmospheric deposits of mercury, which has been carried across the country by the prevailing winds. Correct? |
| DES Answer | Toxic substances are taken up and may accumulate in aquatic organisms. Env-Wq 1703.21(a)(2) specifies that surface waters be free from toxic substances or chemical constituents in concentrations or combinations that persist in the environment or accumulate in aquatic organisms to levels that result in harmful concentrations in edible portions of fish, shellfish, other aquatic life. The NH DES Environmental Health Program performs detailed fish consumption assessments and where warranted publishes fish consumption advisories. For assessment purposes, these published advisories qualify as indicators that the criteria in Env-Wq 1703.21(a)(2) are not being met. There is a state-wide fish consumption advisory for mercury based on elevated tissue concentrations, with the detailed report HERE |
| Comment | DES agreed that all lakes are impaired for mercury. It's best not to eat the freshwater fish you catch in New Hampshire. |
| Question | 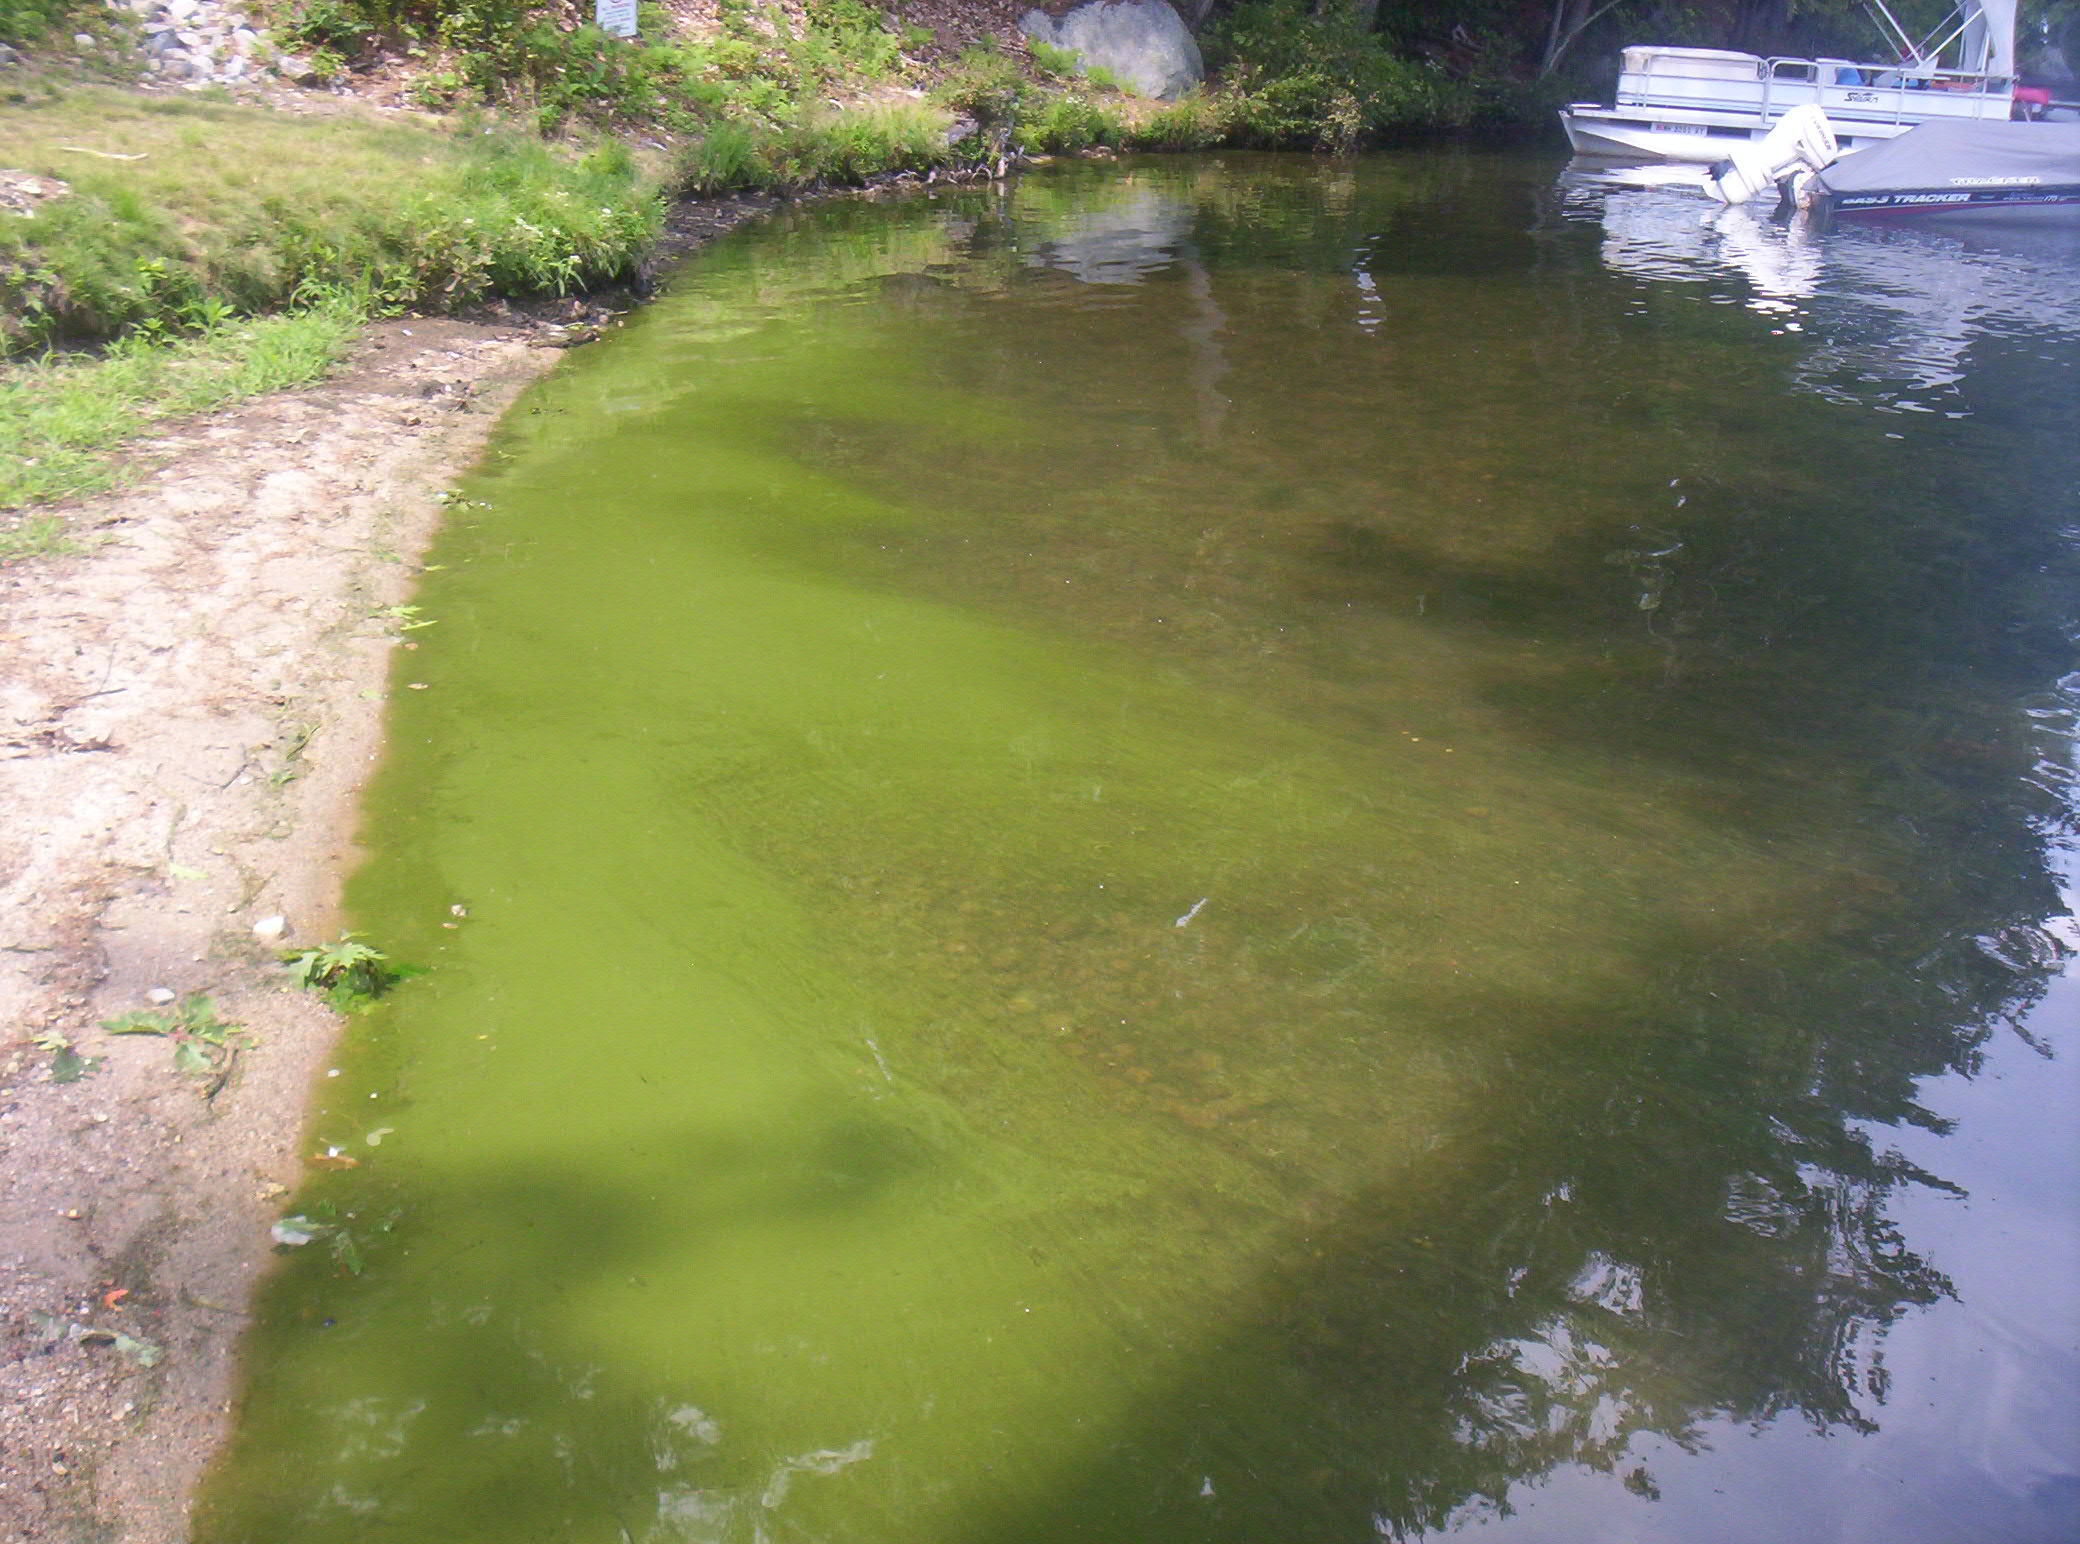
|
| DES Answer | The Primary Contact Recreation assessment criteria for cyanobacteria are discussed in the CALM section 3.2.2, Indicator 5 (see note 3). The language in this CALM indicator originates from Env-Wq 1703.03 (c)(1) b, c, & e. |
| Comment | The 2012 assessment was based on data only through December 2011, so two consecutive years of blooms were sufficient to get the lake an "Impaired" designation. Indeed, cyanobacteria are mentioned on page 40 of the CALM, as a surface scum. It says if a beach is listed as impaired for cyanobacteria, the entire lake is also so listed, because wind and waves can make the cyanobacteria scum move anywhere on the lake. From a terminology standpoint, if you do not want to use the word "cyanobacteria" for any reason, "scum" or "pond scum" are good alternatives. Cyanobacteria were formerly known as "blue-green algae". They were so named before electron microscopes were used to determine that cyanobacteria are nothing like algae, except for their size and their ability to do photosynthesis. It's just hard to get rid of an inaccurate term that was used for decades. However, referring to cyanobacteria as simply "algae" without "toxic" or "blue-green" in front of it is confusing and incorrect; it can mislead people into thinking the normal brown or green algae we are used to seeing in the lake every year may also be toxic, which it is not. "Yucky" maybe, but not harmful. |
| Question | 3. Dissolved Oxygen (DO) Concentration: In 2008, Province Lake had been designated as "Good" (2-G), but in 2010 got designated as "Insufficient
data" (3-PAS). After DO was not measured at all during 2012, because state budget cuts meant there was no biologist visit in 2012, a change to "Insufficient data"
would make sense to me, but why would it have changed in 2010?
Also, in the 2008 list, if the DO concentration was good (2-G), how could there have been "Insufficient data" (3-PNS) for DO saturation? Or was the change in 2010 to correct an error in the 2008 list , where both should have been listed as "Insufficient data"? |
| DES Answer | The indicator thresholds in the CALM for DO in Lakes/Ponds were set with the understanding that DO profiles are not collected in the early morning hours when DO is typically at its lowest levels (see the "Alternative DO Assessment Criteria for Lakes/Ponds" table on page 47 of the CALM). As we pulled the data for the 2010 assessment cycle, quite a few of the DO concentrations were between 5 and 6 milligrams per liter (mg/L). While above the standard (5 mg/L) at the moment of sampling, the concentration is not high enough to have confidence that a sample from the early morning would not have fallen below 5 mg/L. Given this uncertainly, those samples between 5 and 6 mg/L are flagged as 'Insufficient Information'. In the case of Province Lake, these marginal samples drove the total count of DO samples below the 10 needed to say that overall, DO is fully supporting the Aquatic Life. |
| Comment | The previous "Good" (2-G) designation was found, upon re-examination, to have been inaccurate, so the change was a proper correction. In the revised "Insufficient data" (3) designations for 2012, the "PAS" for DO concentration means "Potentially Attaining Standard" (or "Likely Good" or "Encouraging"). In the revised designation for 2012, the "PNS" for DO percent saturation means "Potentially NOT Attaining Standard" (or "Likely Bad" or "Cautionary"). |
| Question | 4. pH: I constructed a spreadsheet using the paper data records I have on file. Looking though it for the pH results, I found that in the last
10 sampling years (2003-2012) there were at least 8 reports of pH that were less than the criteria of 6.5 listed in paragraph 3.2.4, Indicator 2, of the CALM. Since
this exceeded the requirement to have at least 4 exceedances out of 35 data points (per Table 3-13 of the CALM), Province Lake was listed as impaired (4A-M) for pH
in the "Aquatic Life" use category in 2008, 2010, and 2012.
However, Note 1 of Indicator 2 of paragraph 3.4.2 says that assessments shall be based on the most recent data. If the last 3 years (2010-2012) are used to get the total sample size above 10 data points, then zero exceedances were measured in 12 samples. Even if 2009 is included, there is only 1 exceedance in 16 samples, which is less than the 2 exceedances required by Table 3-13 to assess a waterbody as impaired. Therefore, I conclude that Province Lake is no longer impaired for pH, in fact. I realize that there may be regulatory hoops to jump through to get it delisted on paper, but if so, I believe it is still only impaired for pH on paper. |
| DES Answer | 
Delisting an impairment is not as simple as adding an impairment. Delisting requires that we demonstrate that the impairment no longer exists under the same or more limiting conditions for which the problem was original demonstrated. Absence of data does not meet the data needs. So, what does it take to remove a documented impairment? I'll start off by saying that a written explanation cannot capture all possible scenarios, but the general framework I would recommend for evaluating each impairment goes something like this: 1. Base Data: Evaluate the original impairment data in the context of what, where, and when. What parameters(s), where are the stations that showed problems, and when were the problems in the context of flows, season, preceding weather, time of day, and any other when type question that might be relevant to the parameter in question. a. Double check the data to ensure the assessment is correct. Was the original listing correct based on the water quality standards? If no, then why? Keep in mind that EPA will thoroughly scrutinize any delisting. b. If the assessment is based on old data, or few data points, consider resampling. 2. Sources: Are there one or more known sources that caused the water quality problem? In many cases the exact sources are difficult to determine. 3. Work Done: Did some kind of restoration or BMP [Best Management Practice] work take place that should have reduced loading to the waterbody? Documentation becomes critical later in the process. 4. Re-Sampling: Sample based on the what, where, and when of the original impairment to remove or confirm the impairment. While it is true that the assessment focuses on recent data, it is also true that to remove an impairment we must be able to demonstrate that the more recent data demonstrates (like described for DO above) that the impairment no longer exists under the same or more limiting conditions for which the problem was originally demonstrated. The full derivation of the pH criteria is available in EPA's "Redbook". |
| Comment | The graph provided by DES provides compelling evidence that the Province Lake pH does not meet the water quality criteria, even though on average, it might seem to. There are many regulatory hoops to jump through to get the lake delisted, which the data indicate probably will not happen anytime soon. Even so, since there is no significant local control over the causes of low pH, as described in Issue #4 of the PLW newsletter, this marginal impairment is not worth losing sleep over. (Note that Issue #4 is correct about pH and mercury, but outdated regarding other parameters.) |
| Question | 4A. As recently as the 2010 annual VLAP report, a pH of 6 to 7 was said to be "ideal for fish". Why is a pH of 6.0 to 6.5 simultaneously in the "ideal" range for fish and an impairment for aquatic life? |
| DES Answer | The healthy pH level is a realm where DES's water quality assessment programs and lake survey work are now coming into sync. For one reason
or another, and we are unclear why, the DES lake programs chose to use 6.0 many years ago; however, the state Water Quality Criteria (ENV
1703.18) for pH has been >6.5 and <8 since the 1970's. The full derivation of the pH criteria is available in EPA's "Redbook".
While NH has great clean lakes, the geology of our state provides little protection from the acidification that has and is occurring due to burning of fossil fuels. While acid deposition has decreased with implementation of the Clean Air Act, there is still work to be done and it will take a long time for the pH in many of our waterbodies to return to a more natural, healthy state. So even if TP and Chlorophyll-a are reduced, pH will still likely be below 6.5 for many years in some waterbodies while deposition decreases and buffering is restored by primary rock weathering. |
| Comment | Sometimes discrepancies can last for years before they are worked out. It's good to have this one settled. Conclusion: We want our lake pH to be above 6.5, which it usually is. |
| Question | 5. Chlorophyll-a: The Lake Nutrient Criteria Assessment (LNCA) of January 2009 states on page 2 that "For a
lake to be considered impaired for chlorophyll-a, more than 10% of summer samples must have concentrations >15 micrograms per liter (μg/L), which impairs the swimming designated use."
The note on Table 3 of the LNCA says "Impaired lakes are lakes that do not support the swimming designated use due to elevated chlorophyll-a concentrations."
Since monitoring began in 1991, all chlorophyll-a concentrations have been well below 15 μg/L, with a median of 3.642 μg/L. Looking at the last 10 years, the median drops to 3.52 μg/L. Looking at the last 4 years, the median drops to 3.09 μg/L. Clearly, Province Lake is not impaired for swimming use by excessive algae growth, and the 2012 VLAP report agrees, giving its highest rating (Very Good) for chlorophyll-a for swimming use. The Aquatic Life Use Support (ALUS) threshold (CALM paragraph 3.4.2, Indicator 7) for chlorophyll-a for a mesotrophic lake such as Province Lake is 5.0 μg/L, a threshold which is also easily met by Province Lake. (This trophic classification came from the 2012 VLAP report.) Clearly, chlorophyll-a itself is not a problem at Province Lake. |
| DES Answer | The Primary Contact Recreation (PCR) assessment criteria for chlorophyll-a are presented in the CALM in section 3.2.2, Indicator 3. Assessment determinations for PCR using chlorophyll-a as an indicator are made using Use Support Matrix 3-20. The lake has not been listed for PCR as a result of high chlorophyll-a concentrations. The 15 μg/L relates to the public safety and aesthetic enjoyment of surface waters for the primary contact (i.e. swimming) designated use. |
| Comment | All agree that the lake is great for swimming, based on the chlorophyll-a concentration, which is a surrogate for the algae concentration. This is separate from the cyanobacteria issue. |
| Question | 6. Phosphorus (and more on Chlorophyll-a): The ALUS threshold for total phosphorus (TP) for a mesotrophic lake such as Province Lake is 12.0 μg/L.
For all time periods I mentioned for chlorophyll-a above, the median TP is 15 μg/L, so clearly Province Lake is in exceedance of this threshold more often than not.
Since 1991, there have been relatively few measurements that were less than 12.0 μg/L.
Clearly, Province Lake is impaired (5-M) for phosphorus and has solidly earned its listing, probably forever. What I do not understand is why it is listed as impaired (5-M) for chlorophyll-a for aquatic life, when it easily meets the chlorophyll-a threshold. |
| DES Answer | For lake assessments, DES uses the best trophic class observed (see next question for explanation) to set the total phosphorus and Chlorophyll-a thresholds for assessing Aquatic Life Use using the Lake Nutrients Stressor-Response Indicator. DES has conducted three trophic surveys of Province Lake. For Province Lake, oligotrophic is the best trophic class observed (1979 & 1987). Two surveys classify the lake as oligotrophic (1979 & 1987). The 2006 survey classified the lake as mesotrophic. Therefore, since oligotrophic is the best trophic level we've observed, the TP and Chlorophyll-a thresholds for assessment purposes are <3.3 μg/L (Chlorophyll-a )(i.e. response) and <8 μg/L (TP)(i.e. stressor). As described in CALM (section 3.2.4, Indicator 7, notes 9 & 10) this indicator relies on the response variable (Chlorophyll-a) to exceed the threshold before the stressor (TP) is considered an impairment (Table 3-28). |
| Comment | Learning that Province Lake was previously reported as being in the best trophic state changes my view. It makes sense not to ease the thresholds in response to degradation in trophic state, where restoration to the better trophic state should be a goal. See the next question for some insight into trophic state. |
| Question | Please explain trophic classifications. |
| Answer | Per Wikipedia:
1. "An oligotrophic lake is a lake with low primary productivity, the result of low nutrient content. These lakes have low algal production, and consequently, often have very clear waters, with high drinking-water quality." 2. A eutrophic lake has high biological productivity. Due to excessive nutrients, especially nitrogen and phosphorus, these water bodies are able to support an abundance of aquatic plants or algae. 3. "Mesotrophic lakes are lakes with an intermediate level of productivity." For further information, see the presentation slides titled "Trophic Classification of Lakes" by Dianne Gravel of UNH. The sources of the data or the methodologies for computing the data that are presented in the NH Lake Trophic Survey reports are explained HERE. |
| Comment | This question was not asked of DES, but trophic states were mentioned enough in my questions and DES answers that some explanation was warranted. |
Happy Summer,
Norm Dudziak, P.E., I.M.
Legal Disclaimer: I am a degreed environmental engineer, licensed in Maine and other states, but my communications on this topic are educational in nature. Due to my professional engineering licenses, I am required to say that this communication does not constitute engineering work, even when using my engineering knowledge. I do not speak for anyone but myself, in the form of my company, E and I Services, LLC.
Terms of Use: Anyone is allowed, even encouraged, to link to this page. However, no one is authorized by the author
or by E and I Services, LLC
to copy the content and post it on another web site.
This web site is owned by E and I Services, LLC and has no affiliation with any other organization.
Copyright © 2013-2024 by E and I Services, LLC. All rights reserved.