Water Quality Monitoring of Province Lake
Effingham & Wakefield, New Hampshire, and Parsonsfield, Maine
2015 Report - Published Online on July 21, 2016
2015 was the 25th consecutive year of water quality monitoring conducted at Province Lake. The first 23 years of monitoring were conducted as part of the New Hampshire Volunteer Lake Assessment Program (VLAP). In 2014, the Province Lake Association (PLA) switched to the University of New Hampshire (UNH) Lakes Lay Monitoring Program (LLMP). Making this change had multiple benefits, including a longer sampling season, lower costs, monitoring for additional parameters, and eliminating the 3-hour-plus round-trip that someone had previously needed to make to the VLAP laboratory in Concord. The downside is that the 23-year continuous record of consistent analyses by VLAP has been broken. There is also no longer a New Hampshire State Report. The impact, as described by Sara Steiner, NH DES VLAP Coordinator, in an email to me on 1/15/2015 is:
"UNH LLMP sampling methods are slightly different than VLAP. This may cause a disruption in some deep spot historical trend analyses, or at the very least you would have to note that starting in 2014 collection methods changed. Chlorophyll-a and Secchi disk transparency methods are the same. The collection of total phosphorus is slightly different as UNH collects and analyzes total phosphorus from a column of water (the same column chlorophyll-a is analyzed from), while VLAP collected a discrete total phosphorus sample at a single depth."
The deep spot was sampled 6 times (May through October) in 2015, the same as in 2014. The standard inlets and lake outlet were sampled 9 times (April through October), while several other places were sampled 3 or 5 times.
I obtained the 2015 data for analysis directly from Bob Craycraft of UNH Cooperative Extension. Although the data do not go directly to VLAP, he previously had said "we will be sending the data to DES for upload onto their Environmental Monitoring Database (EMD) once we have finalized the compilation of data from all participating lakes." All data are therefore public information. In order to compare 2015 UNH results to prior years, only the June through September data were used in this report.
Many of the terms in this report include hyperlinks to related web sites. By clicking on most of the underlined terms, you can access additional information. If the same word is hyperlinked more than once, the different occurrences lead to different web sites. Clicking on most photos will get you a large photo with wider angle and higher resolution. The same copyright applies to these photos.
Use this menu to jump to a particular topic:
Overall Summary
- We had no reportable cyanobacteria blooms in 2014 or 2015 after having had them 4 years in a row, (2010-2013).

WARNING: Since Province Lake has a history of cyanobacteria blooms of varying severity, it is advisable to have a look at the water each time you or your children plan to swim. We've been lucky lately, but caution is always advisable. Since a cyanobacteria bloom is readily visible, if you don't see it, swimming is safe. - Water transparency was the 4th best of the 10 most recent summers, so about average.
- Average phosphorus concentrations in the upper layers of the lake rose to be the 5th highest in 25 years, yet chlorophyll-a dropped to be the 5th lowest in 25 years.
- The average acidity in the lake was approximately equal to several of the lowest averages (highest pH's) recorded during the 25 years of monitoring. This is good.
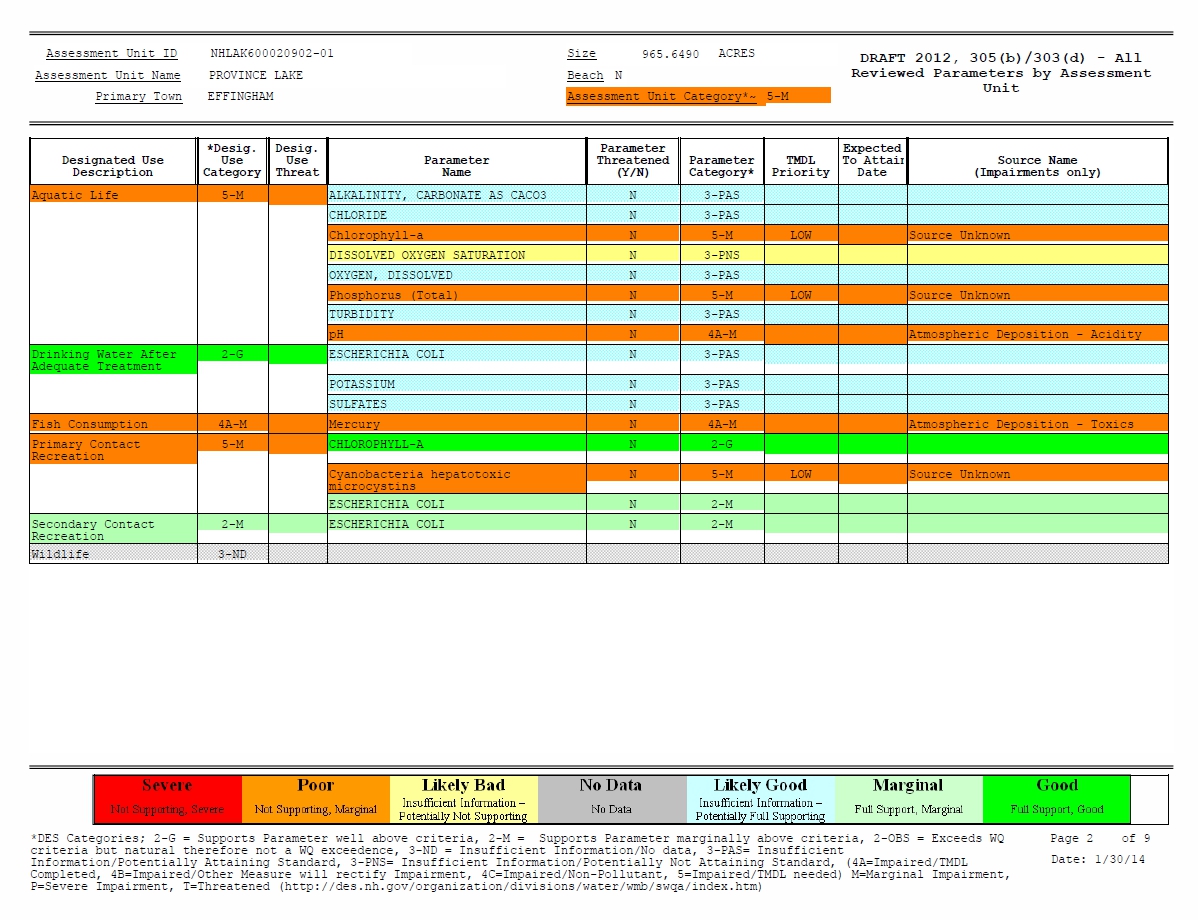
- There was good news to be found when the latest (2014) watershed report card
was compared to the old (2012) report card. (1). The good news is that for swimming
and boating uses, the E. coli bacteria parameter has been upgraded to the best rating, "2-G", defined as "Supports parameter well above criteria".
This also caused the boating use rating to be upgraded to "2-G". However, Province Lake remains rated "5-M", "Marginally Impaired" for swimming, because of the
repeated cyanobacteria blooms. Read what "impaired" means.
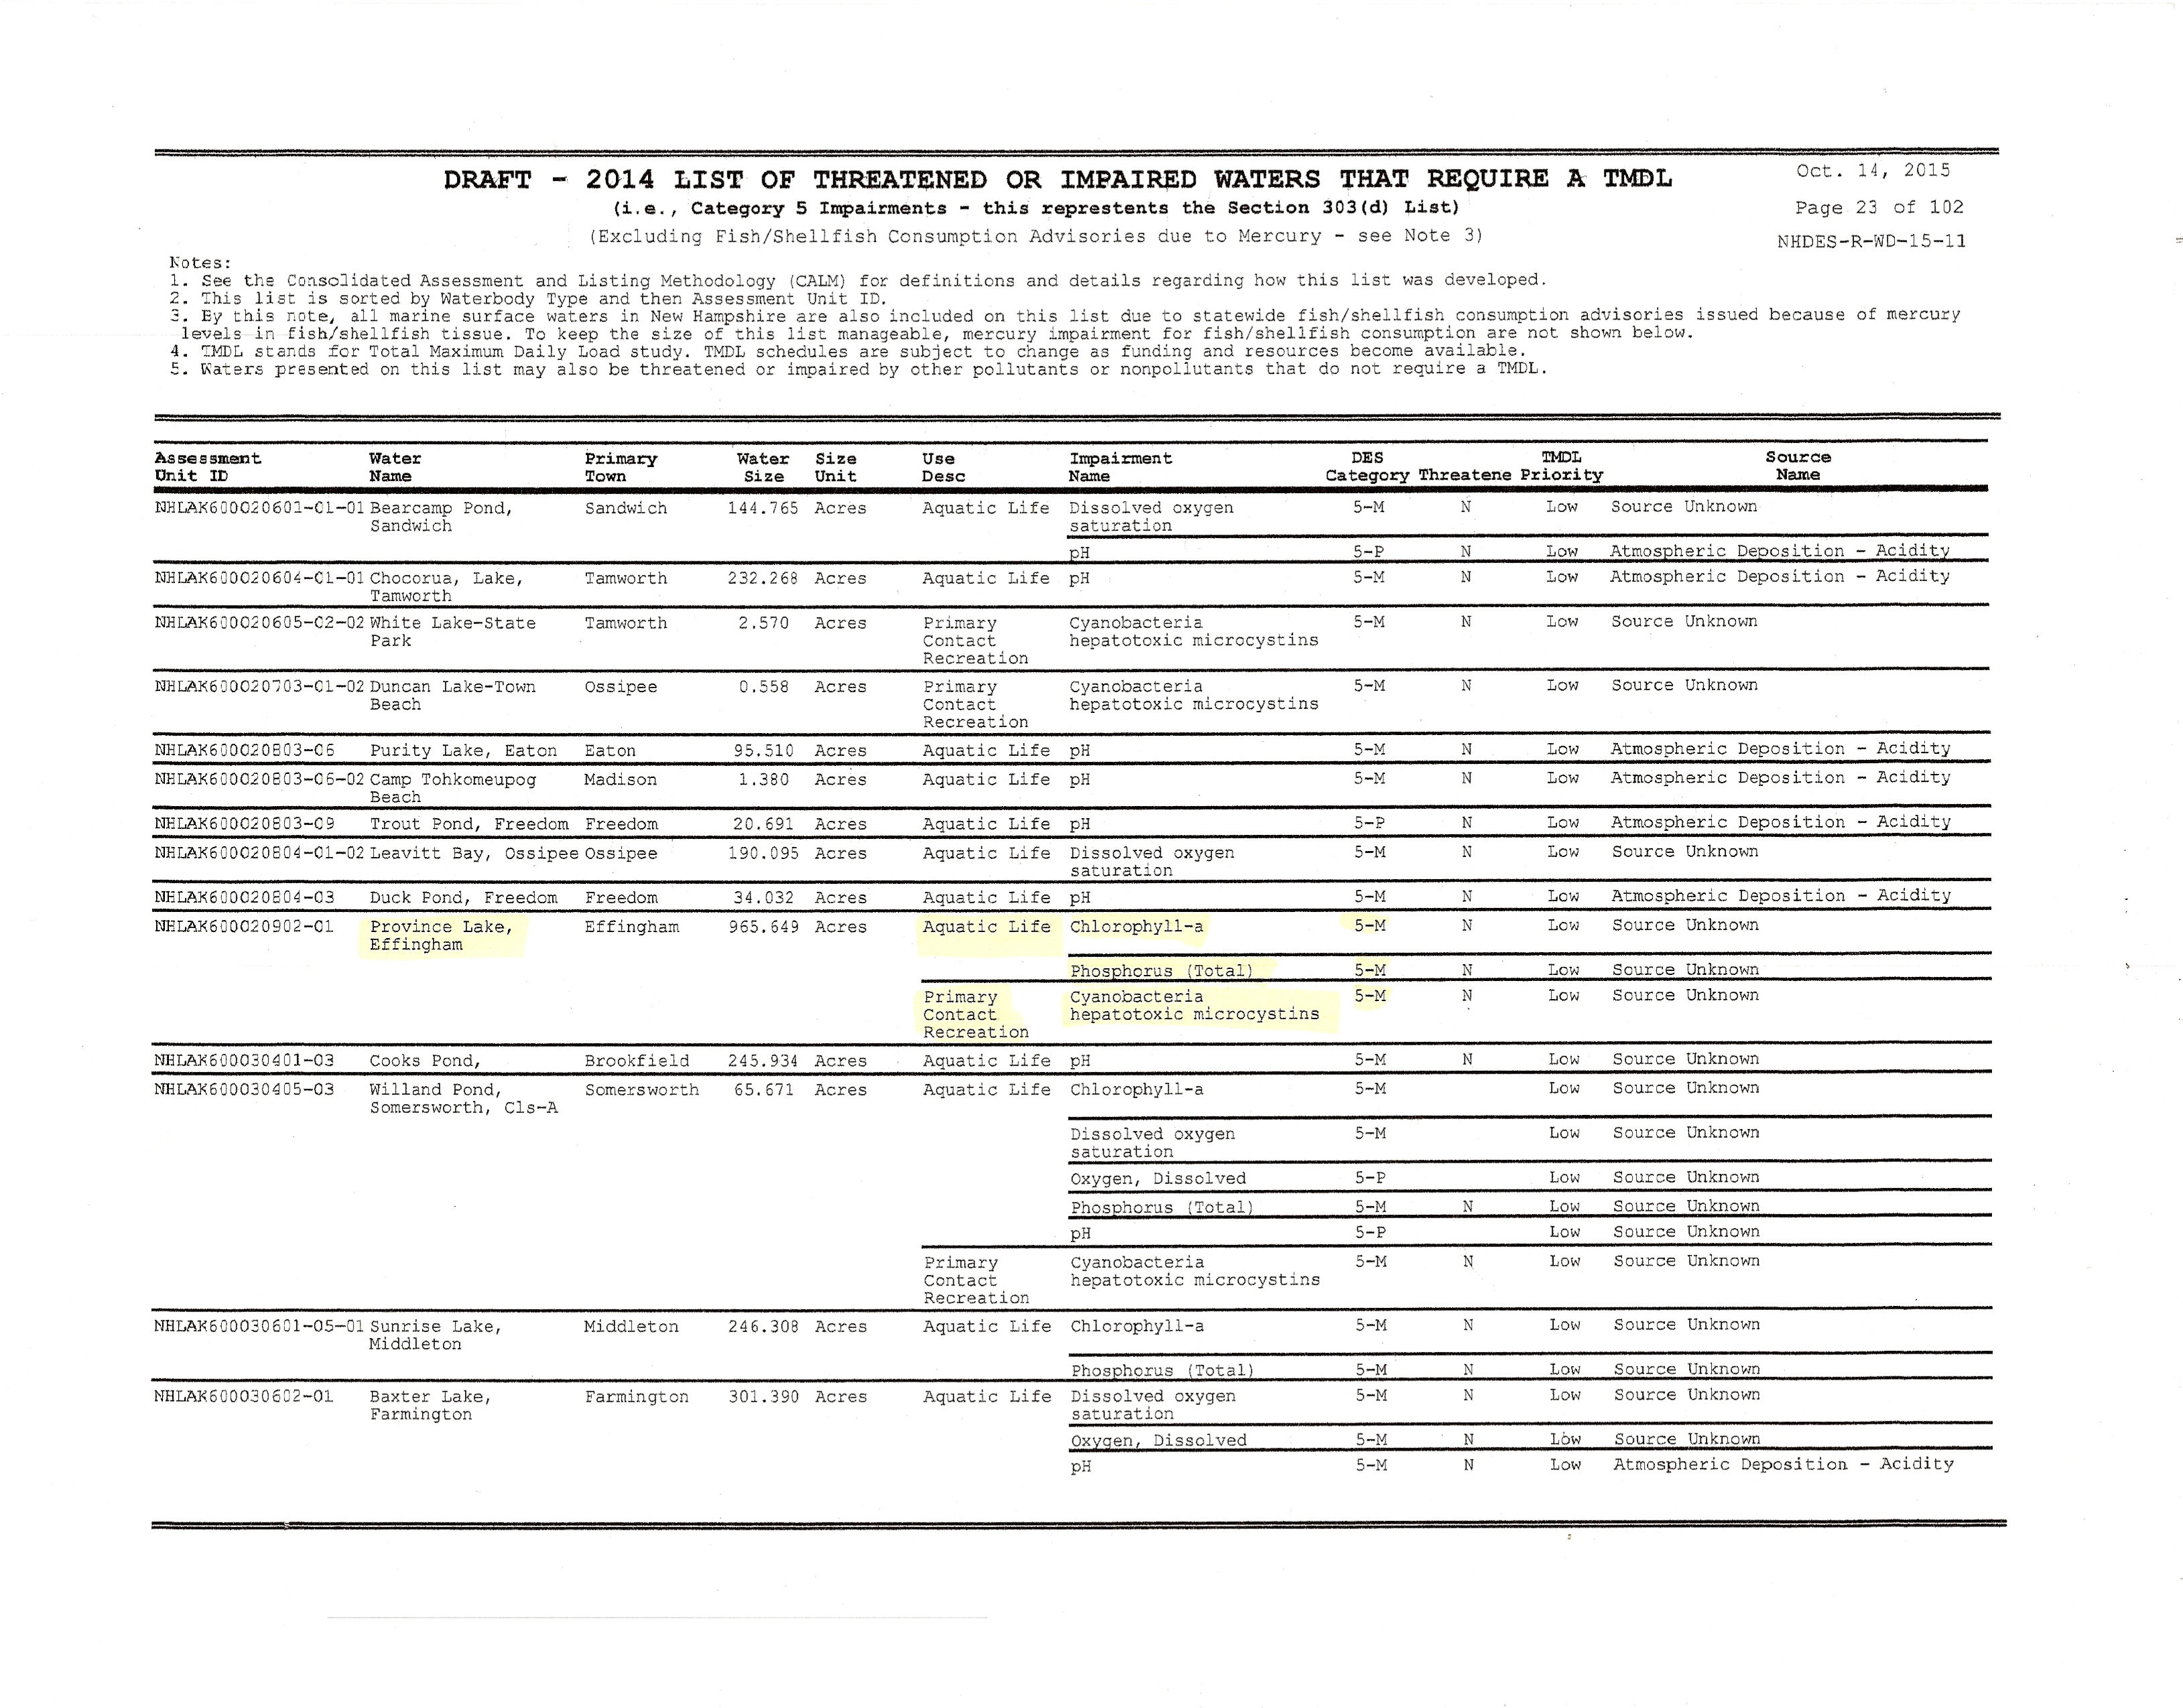
Since 2010, Province Lake has been listed as "Marginally Impaired" in the "Aquatic life" use category for chlorophyll-a and total phosphorus. By 2008, the lake had already been so listed for pH and mercury in fish. On the 2014 list for "Drinking water after adequate treatment", Province Lake still received the "2-G" rating.
Details
This section provides a more detailed look at the UNH LLMP water quality data for Province Lake in 2015. Note that in order to make comparisons to results from earlier years, ONLY the data from June through September of 2015 are used. It is wonderful that data are now being collected during more months, so that after 10 years of doing so, any statistical trends might possibly be seen. Data from the excluded months is outside of the peak growing season, so is not typical.
1. Water transparency (a measure of how deep you can see into the water) was an average of 2.75 meters (9.0 feet), a slight decrease of 3 inches from the prior year (2014). It is the 4th best transparency of the 10 most recent summers, so about average. The transparency I am reporting is that which is measured without a viewscope. I use this one because it represents how most people actually observe the lake. The viewscope method represents how you would see the lake through a diving mask or swim goggles. For comparison, the 2015 viewscope transparency was 3.17 meters (10.4 feet).
As always, Province Lake's transparency was less than the statewide median (without a viewscope) of 3.2 meters (10.5 feet). We have a shallow lake, so sediments are easily stirred up. The deepest part of the lake is only 16 to 17 feet deep, as shown on the bathymetric chart.
2. Chlorophyll-a concentrations are used to indicate the average amount of algae (2) in the lake. The 2015 chlorophyll-a concentrations averaged 3.18 micrograms per liter (ug/L), the 5th lowest in 25 years, in marked contrast to the previous year's 4.73 ug/L, which was the 4th highest in 25 years.
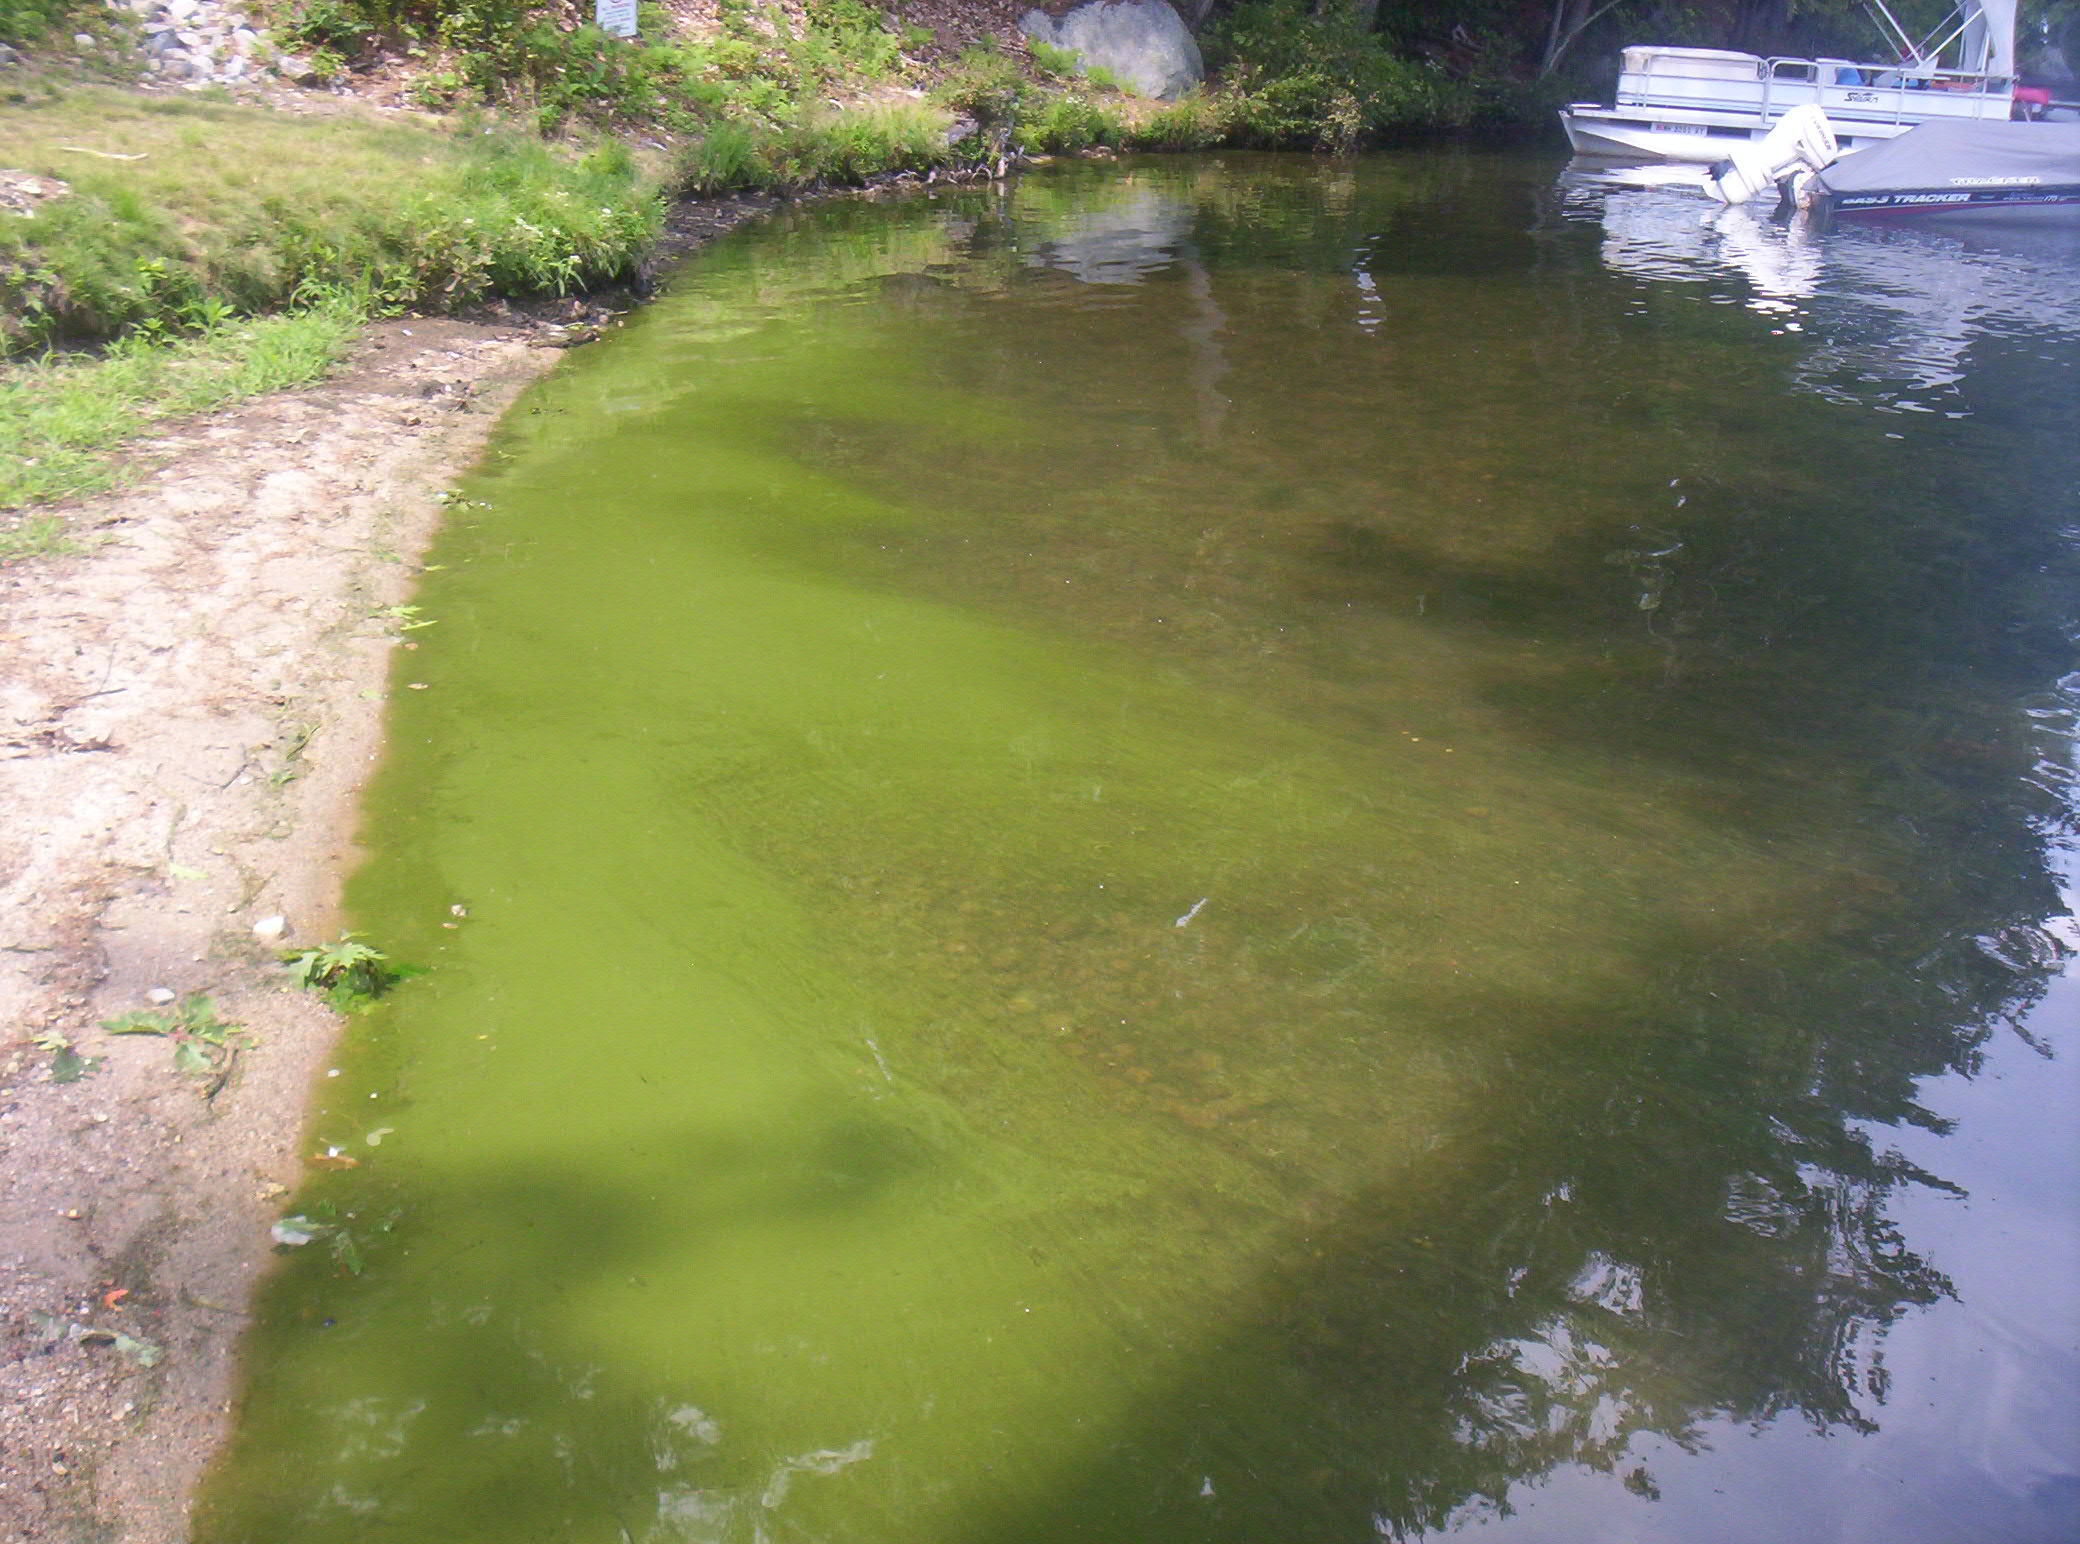
This places our average concentration at only 69% of the amount that New Hampshire lakes had, on average. Happily, Province Lake has been below the current NH median chlorophyll-a of 4.58 ug/L since 2005 and has only exceeded it 4 times in 25 years. A low level is good because dying algae forms the brown floating bottom masses that come to your shore when the wind blows hard in July and August. The algae masses settle loosely on the bottom when the lake is still and cloud the water when wind or boat wakes stir things up. This may be unsightly, but it is not harmful to anyone or their animals.
3. Phosphorus is a nutrient required for photosynthesizing organism growth and is typically thought to be the nutrient whose availability most limits plant, algae, and cyanobacteria growth in NH lakes. In 2015, the average phosphorus levels in the upper water layer (sampled at 2.0 meters depth) increased 22% over the previous year, which itself was a 24% increase over the year before that, after 3 consecutive year of decreases (2011-2013). The 2015 level once again exceeds that in 50% of the lakes in NH, as it usually has. The 2015 phosphorus level is the highest it has been since 2002 and is the 5th highest in 25 years, which is not good.
Such concentrations over the years have been high enough to earn Province Lake a "Marginal Impairment" listing in the "Aquatic life" use category because of total phosphorus concentrations. 2010 was the first year ANY water bodies were listed for total phosphorus, as explained in in 2013's Issue #5 of the Province Lake Water Newsletter.
In the lower water layer (sampled at 4.0 meters depth), the average phosphorus levels were identical to those at 2.0 meters, 8% lower than the previous year, but still the 3rd highest since those measurements started in the year 2000.
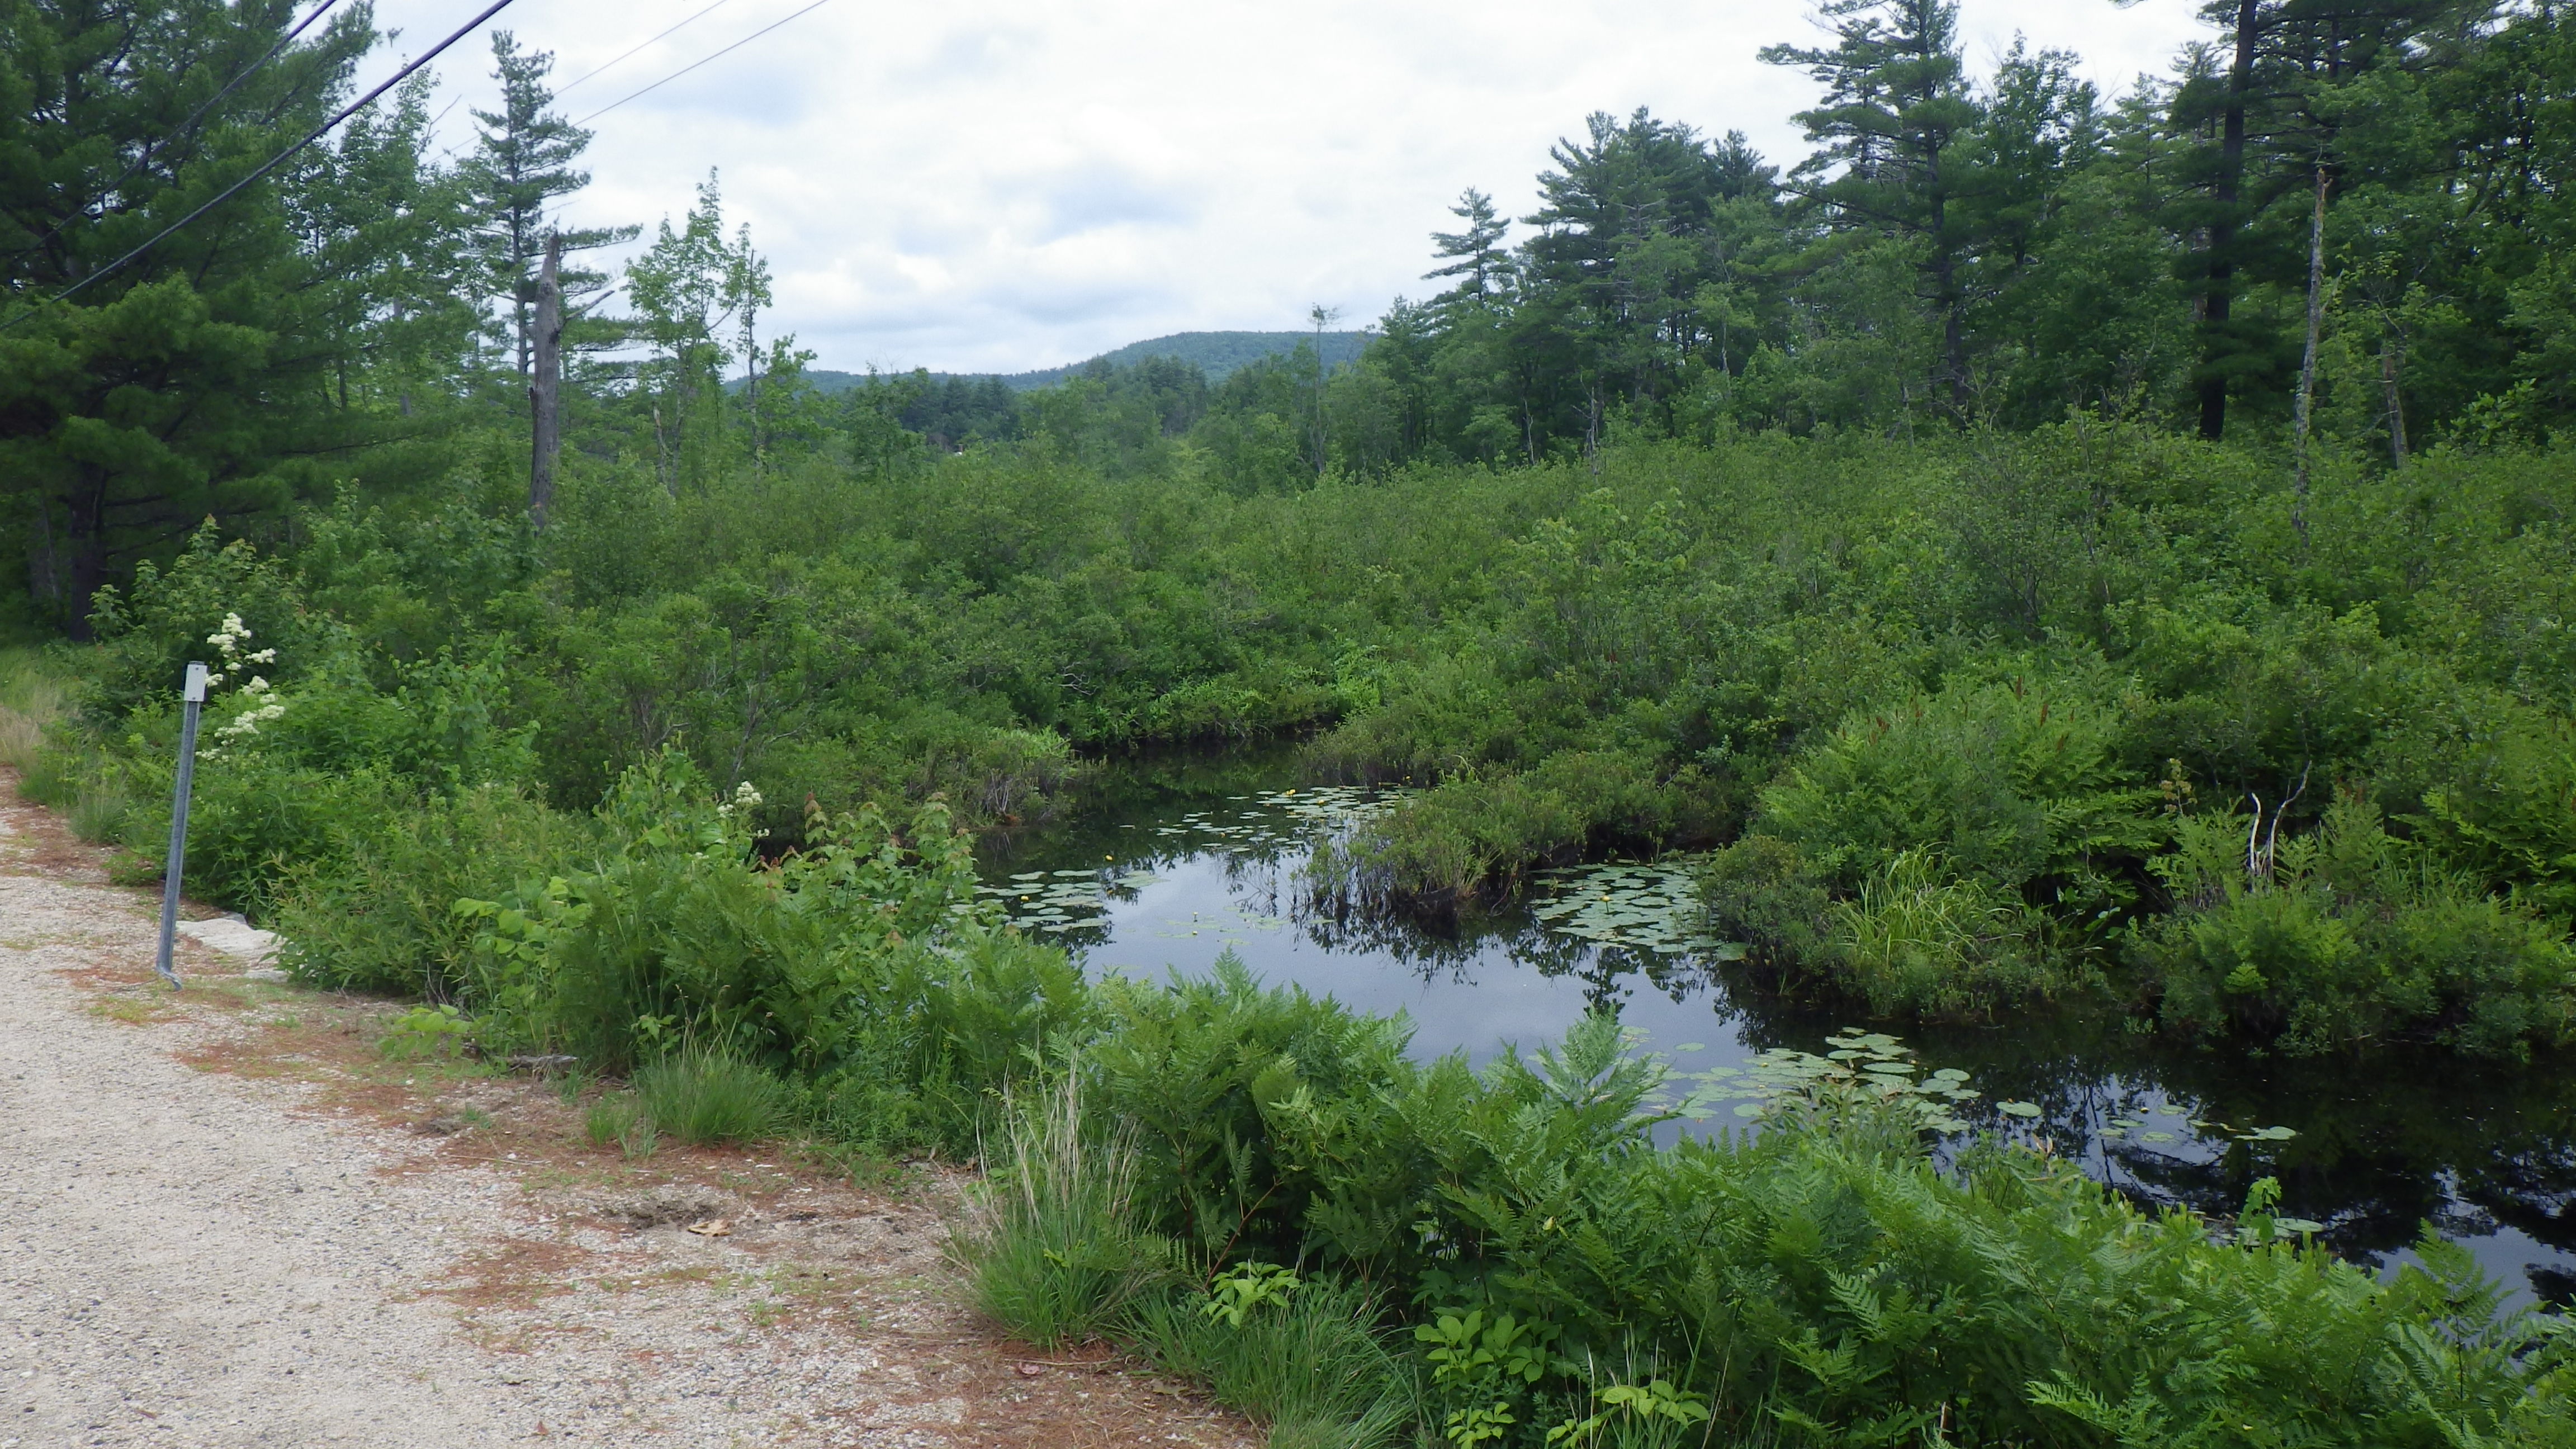
The phosphorus concentration at the Rt. 153 Inlet (in NH, near the state line) continues to be elevated, with its 2015 level a 36% increase over the previous year, making it the highest average concentration since 2011. Even so, this was the 12th lowest in 25 years, so still about average, so hopefully a matter of natural variation. The average phosphorus concentrations measured at the Island Inlet on Bonnyman Road were a 24% increase over 2014, also making it the highest average concentration since 2011, but still the 8th lowest in 25 years, so not of great concern. Phosphorus clings to sediments, so soil erosion and sediment disturbance can increase phosphorus concentrations. Both inlet locations have a history of elevated and fluctuating total phosphorus concentration. The lake view at the Island Inlet is shown here. Click the photo to see where the sample is taken.
It is important to educate lake users on the importance of operating jet skis and boats at slow speeds in shallow areas to minimize disturbance to sediments and vegetation. Churning up the bottom sediments releases phosphorus, which promotes plant, algae, and cyanobacteria growth; increases turbidity (scattering of light by suspended particles), and decreases clarity.
4. Chlorophyll versus Phosphorus at the Deep Spot: The coincidence in 2015 of the 5th lowest chlorophyll with the 5th highest phosphorus is a bit of a conundrum, considering the general wisdom that high phosphorus leads to high productivity and high chlorophyll concentrations. I did a simple correlation analysis of average chlorophyll and phosphorus. Since I could reasonably expect the phosphorus concentrations measured at 2.0 and 4.0 meters depth at the same place and time to be highly correlated, I tested the relationship of their seasonal averages first, getting an R value of 0.70, which means that the shared variation (R2) is about 50%. Since the latest 2 years (2014-15) of sampling and analysis were done by UNH using a different sampling protocol and laboratory than the previous 23 years with VLAP, I repeated the same statistical test, but excluding the 2014-15 data. This gave me a new R of 0.76 and a shared variation of about 58%.
With these results as a baseline, I tested the correlation of average chlorophyll and phosphorus concentrations. Using the 2.0 meter depth data for all 25 years, I got an R of 0.34, meaning that about 12% of the variation in chlorophyll is probably due to phosphorus. Taking out the 2 UNH years increased R to 0.38 and the shared variation to about 15%, indicating that differences in sampling and laboratory methods interfere with the ability to see the correlation. Testing the 4.0 meter data with only the 15 years of data available gave much lower R values, so insignificant correlation.

By way of illustration, see the chart at right (Click it to enlarge it.) This is copied from the final VLAP report for Province Lake, with data through 2013. Here you can see that phosphorus has something to do with chlorophyll, but clearly there are other factors involved.
My conclusion is that average phosphorus concentration at 2.0 meter depth does not predict average chlorophyll concentration by itself, but that it is a significant contributor. Temperature, precipitation, sunlight, and turbulence from wind and boat traffic are probably the main contributors, but we do not have a chance of controlling those factors. Erosion control and other measures present opportunities to reduce phosphorus inputs to the lake, so that is what we in the community do.
From this statistical analysis, we also see proof that Sara Steiner of VLAP was probably correct about the disruption of deep spot historical trend analyses by switching from VLAP to UNH, as expressed in her email quoted in the introduction of this report.
5. We had never sampled Province Lake for nitrogen as part of VLAP, but it is now included in the new UNH Lakes Lay Monitoring Program. A 1987 DES Lake Assessment Program survey had concluded that plant and algae growth in Province Lake is actually limited by the amount of nitrogen, rather than by phosphorus. Now that nitrogen is being monitored, we have the potential to eventually learn if that is true. Meanwhile, it is important to be sure nitrogen-containing fertilizers are not used near the shoreline, or streams or ditches feeding the lake, and to be sure septic systems are operating properly. It would also be a tiny help not to pee in the lake while swimming; each time adds about 40 milligrams of nitrogen to the water.
If you have a lush, bright green lawn, it will be a sign to your neighbors and the community that you are fertilizing your lawn, possibly making a significant contribution of nitrogen and/or phosphorus to the lake. A natural landscape or ratty to mediocre lawn shows that you care about the water quality of Province Lake. As a bonus, it also takes less expense and effort.
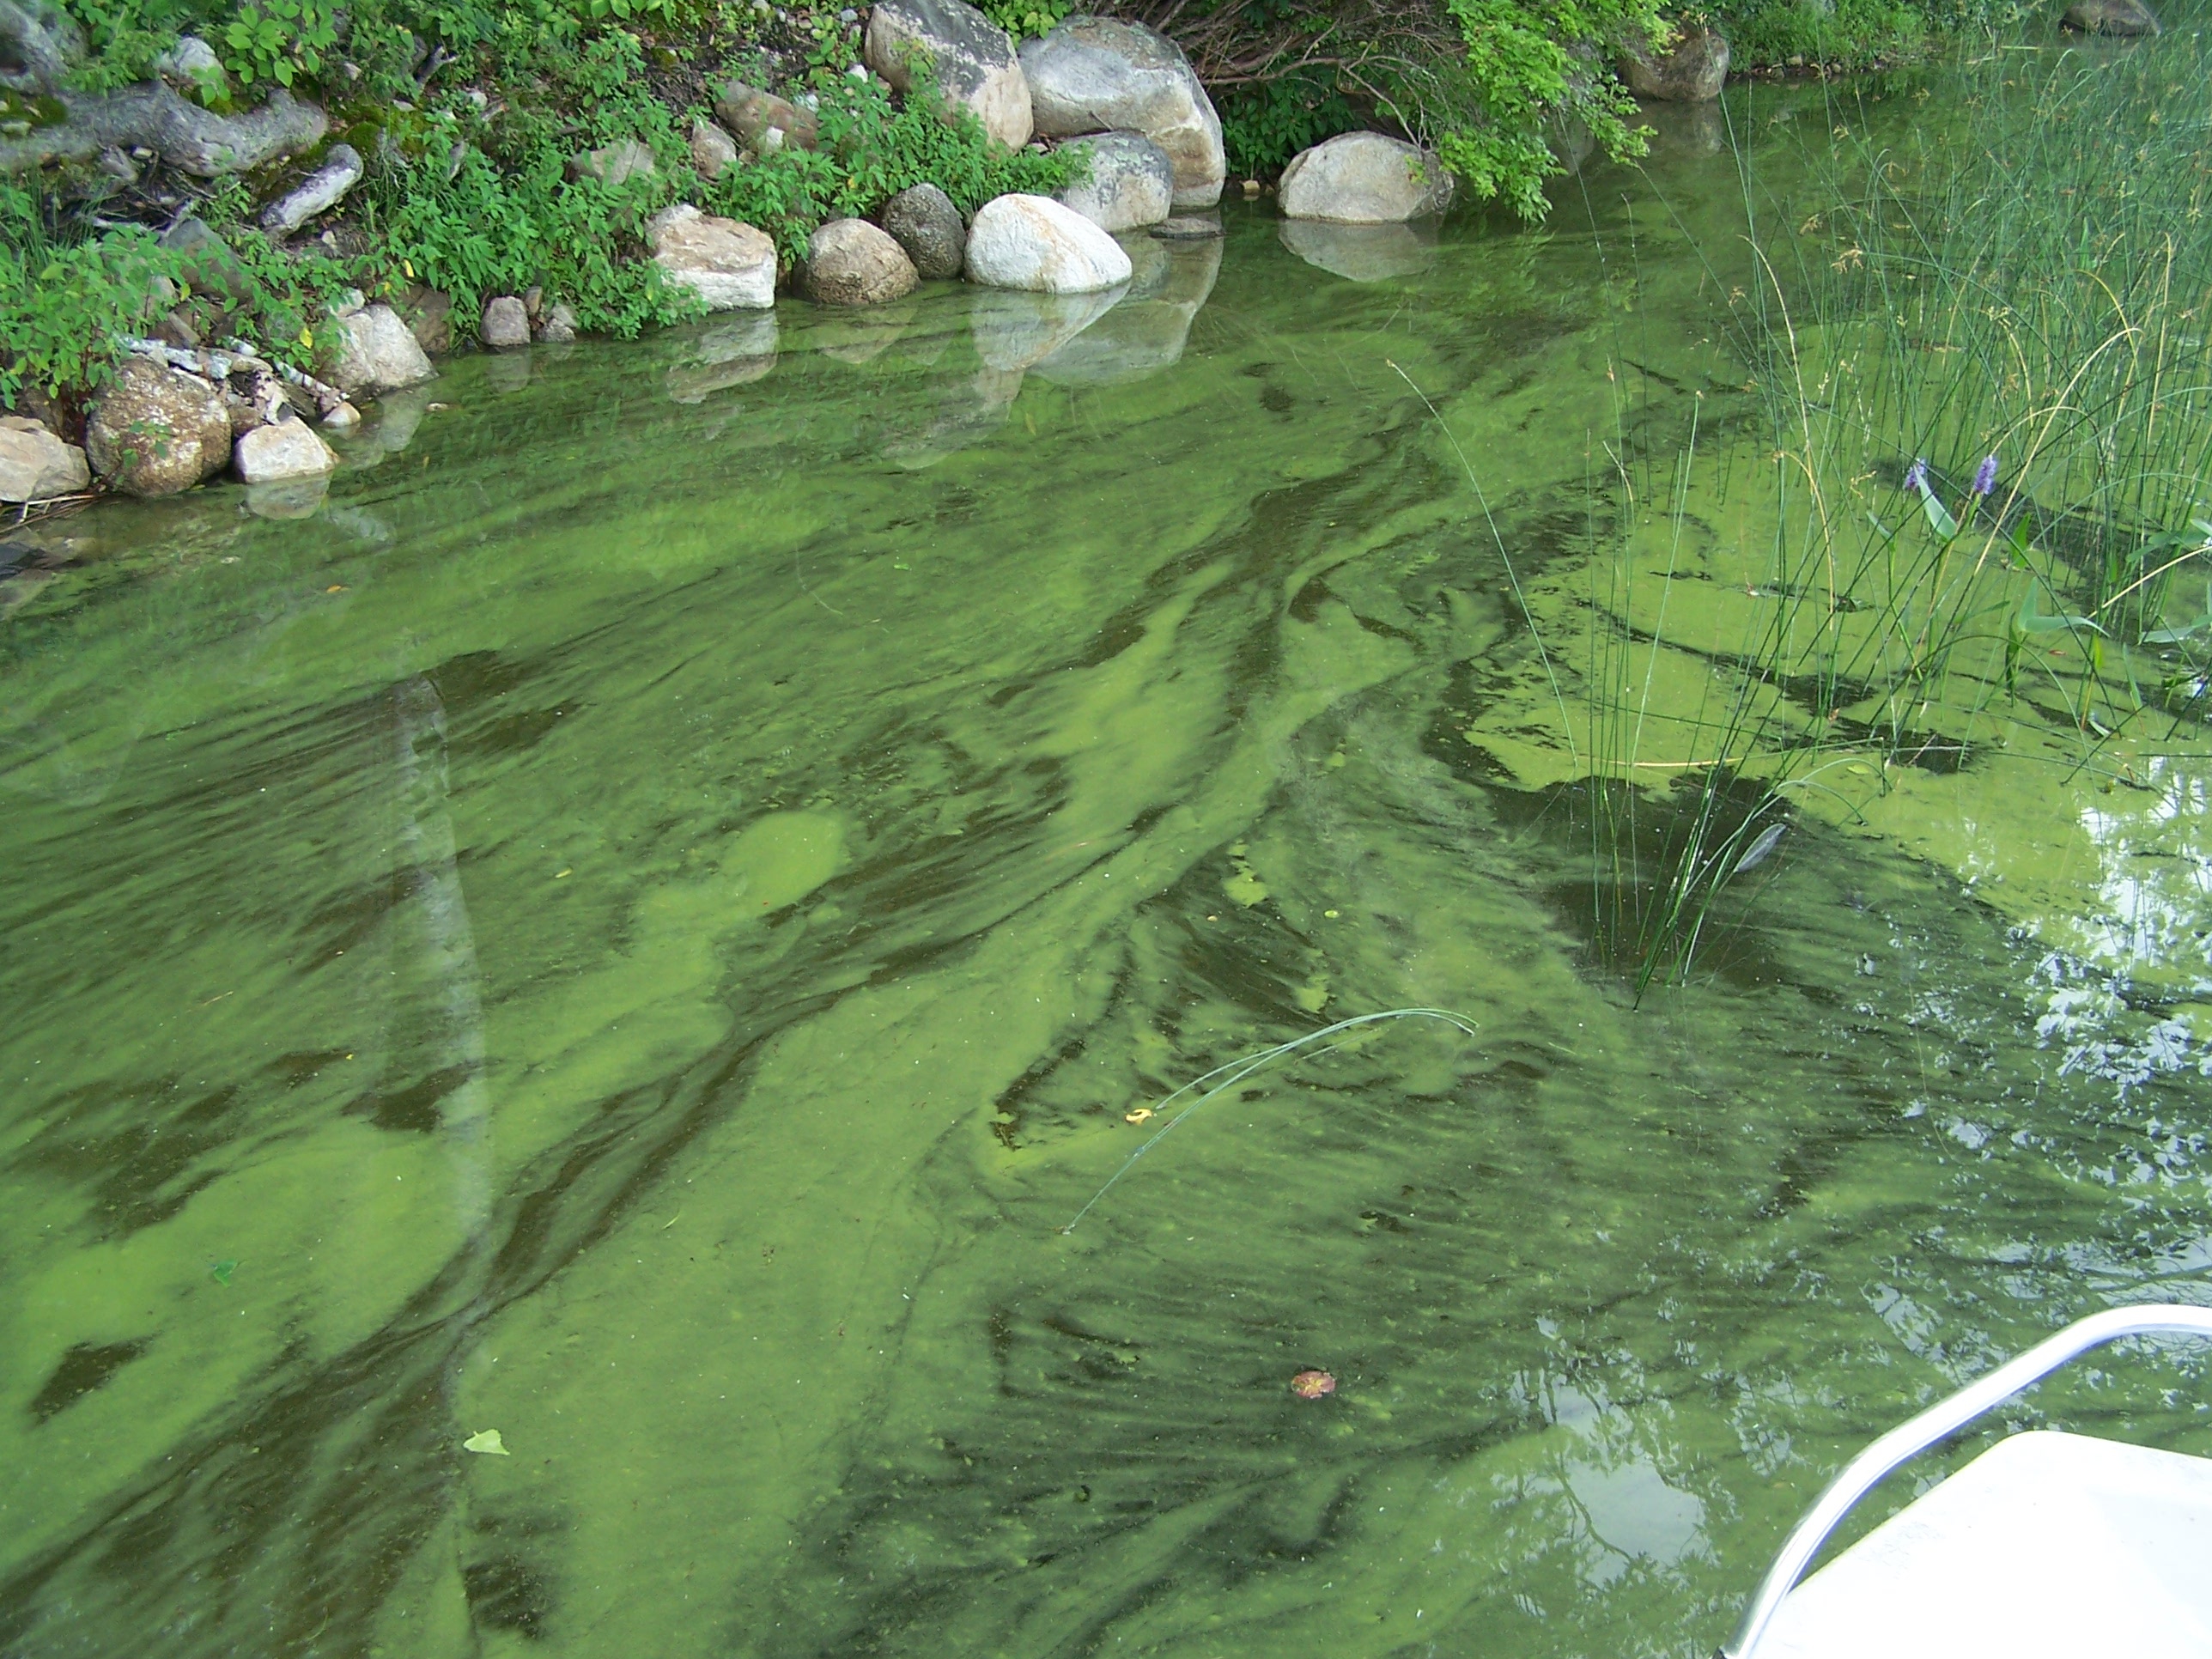
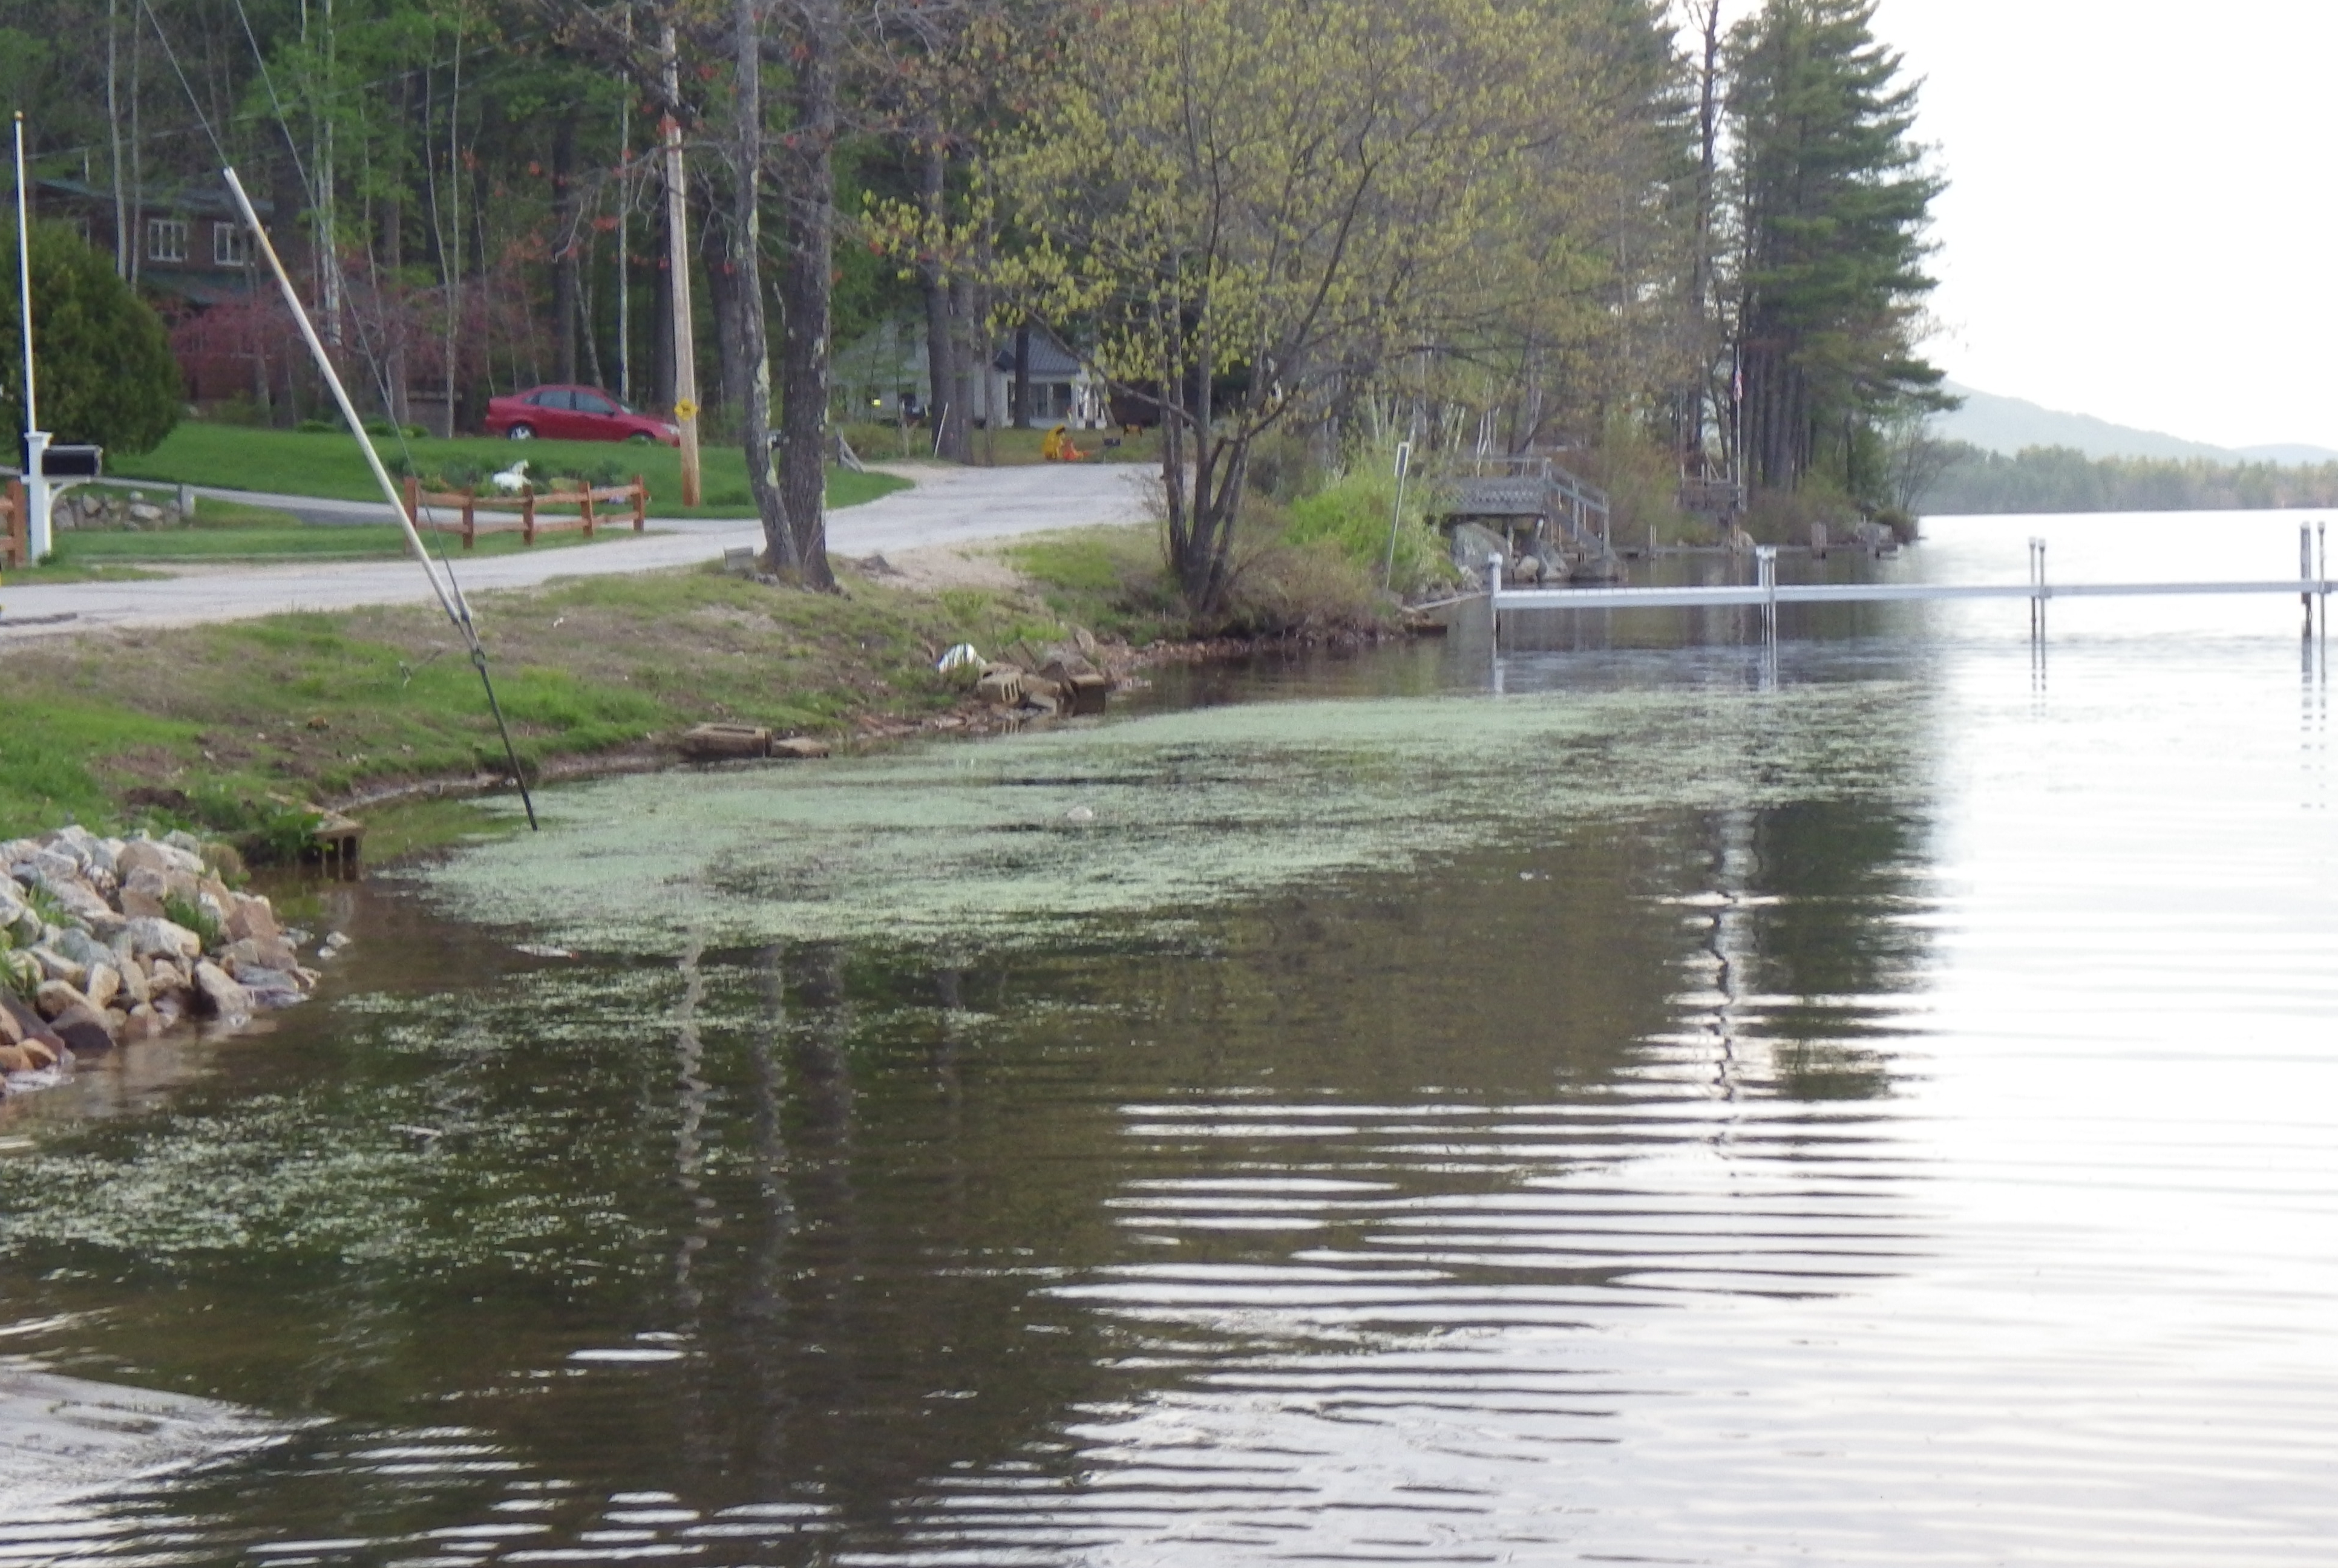
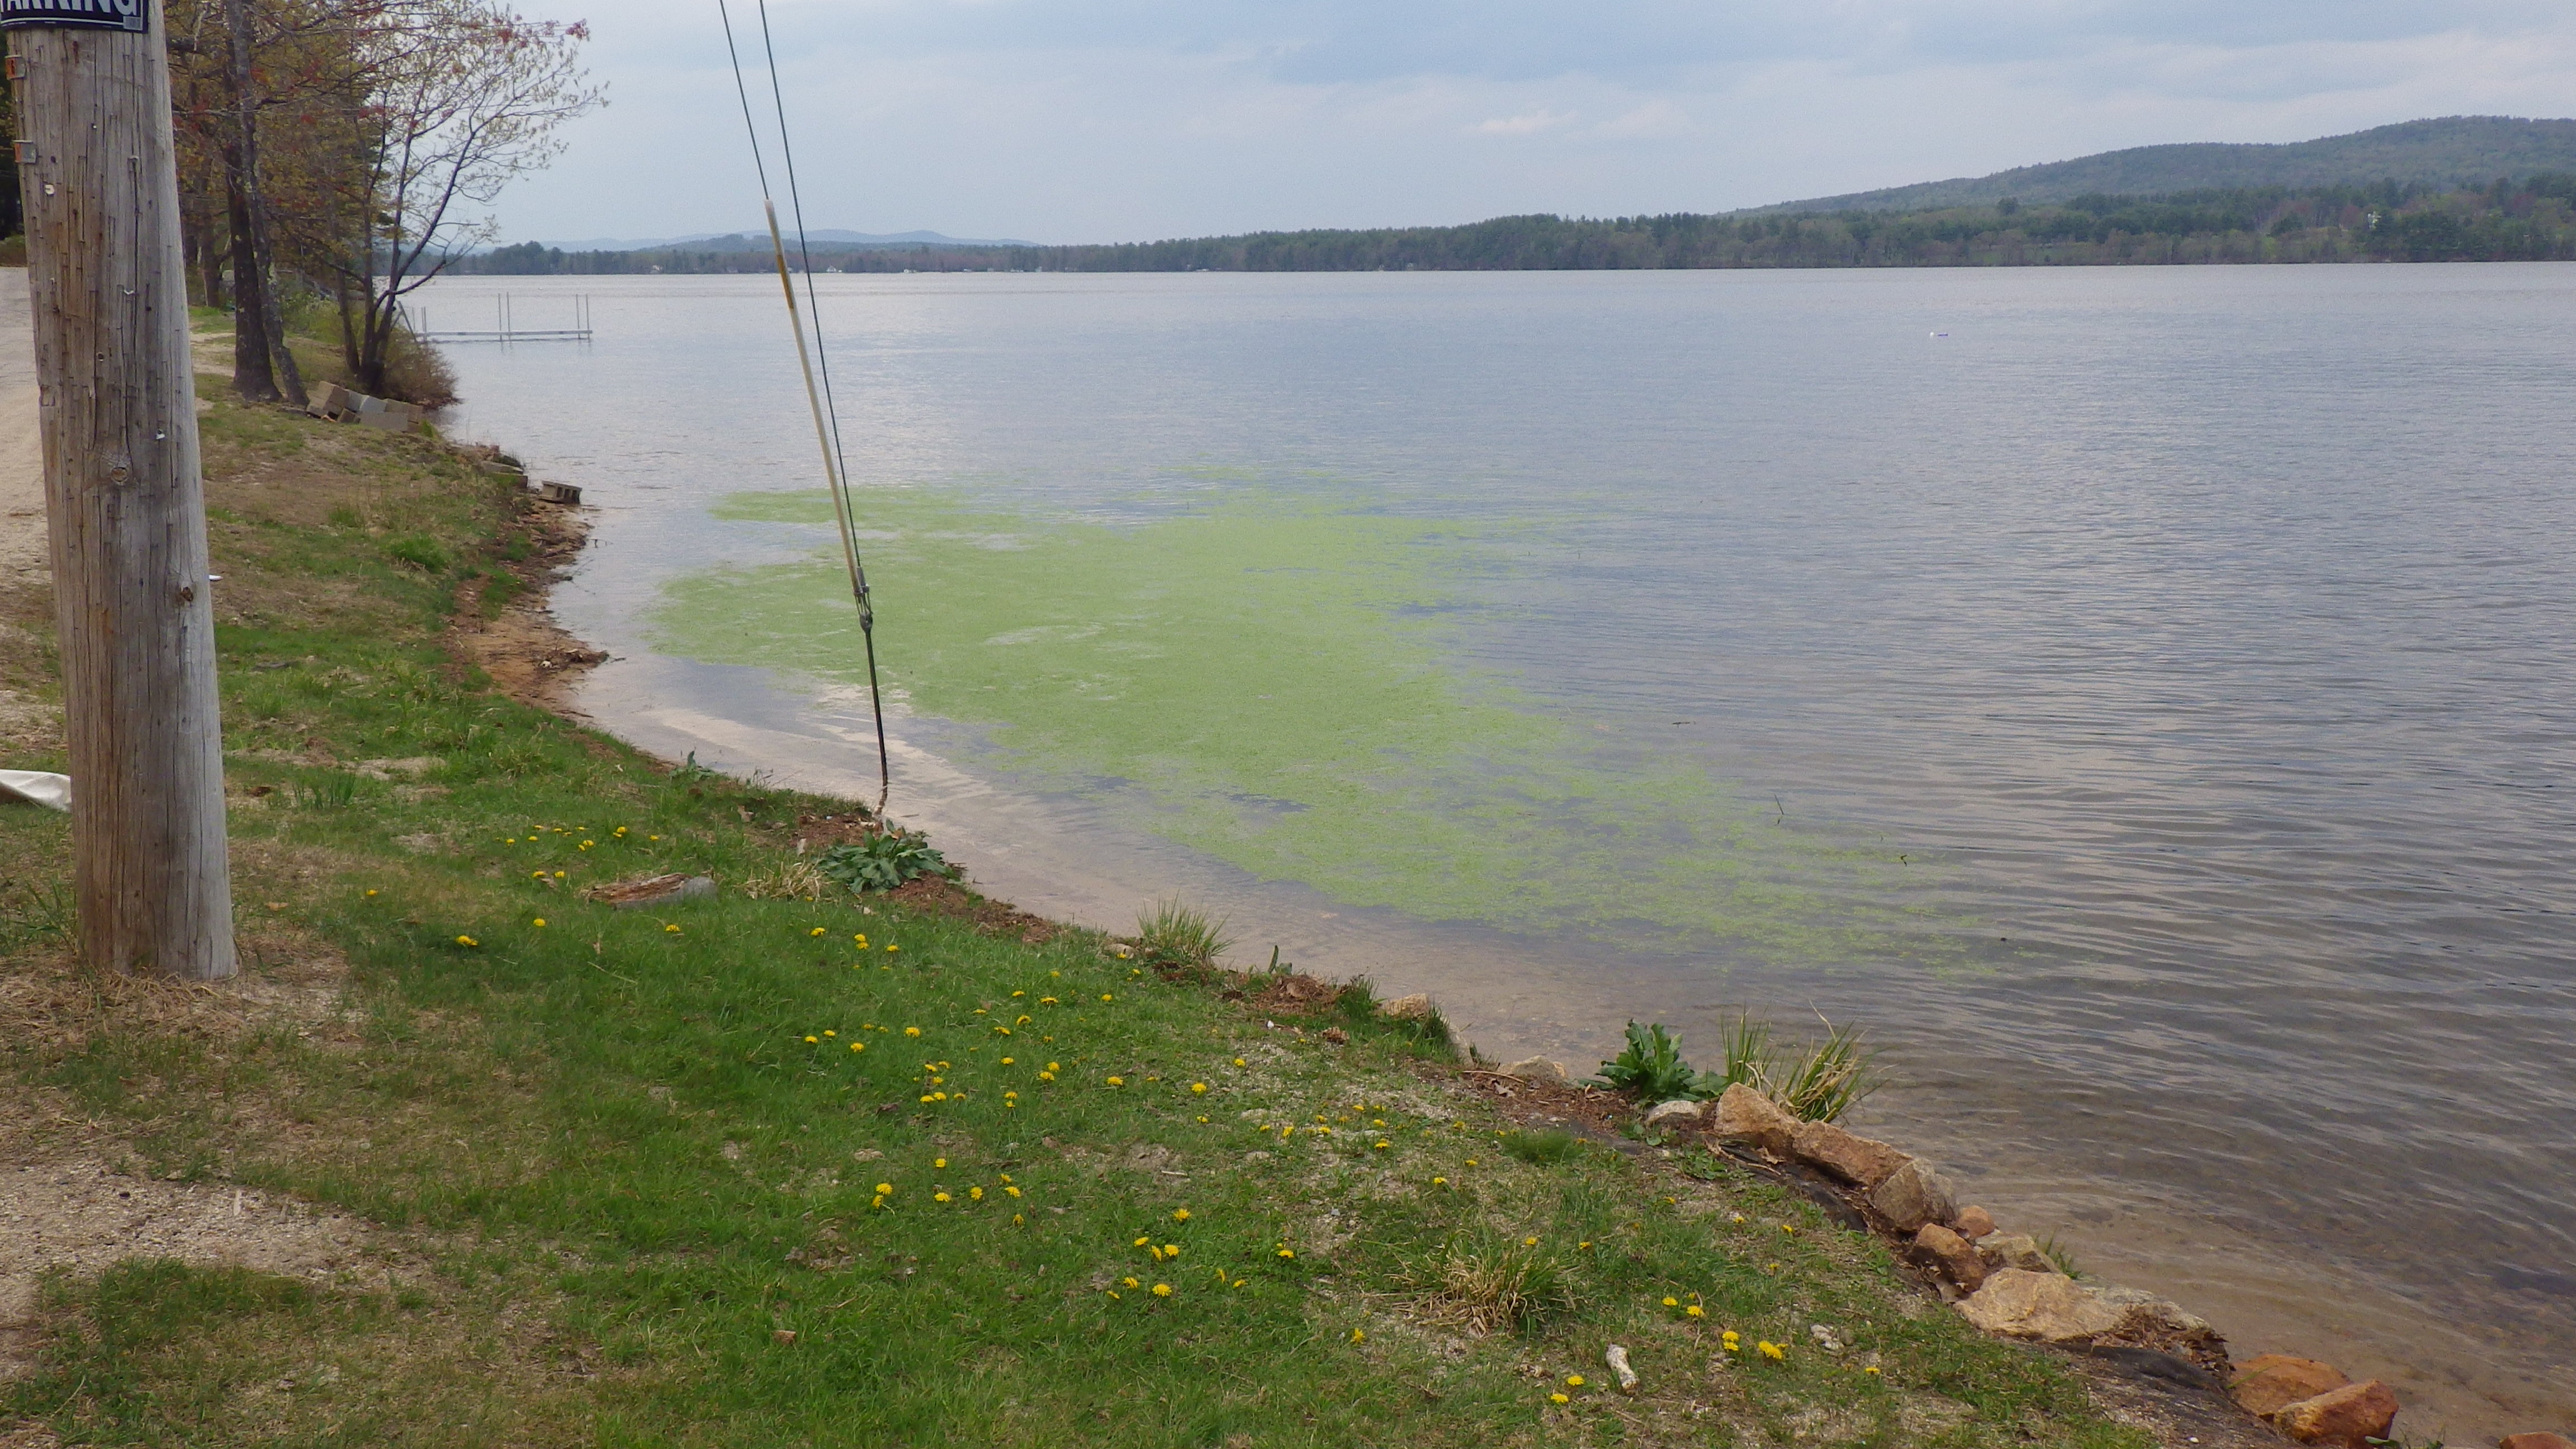
6. Province Lake started Summer 2013 with a cyanobacteria bloom on June 21st and occasional sightings were reported throughout that summer. Fortunately, no sightings worthy of a Lake Warning occurred in 2014, 2015, or so far in 2016.
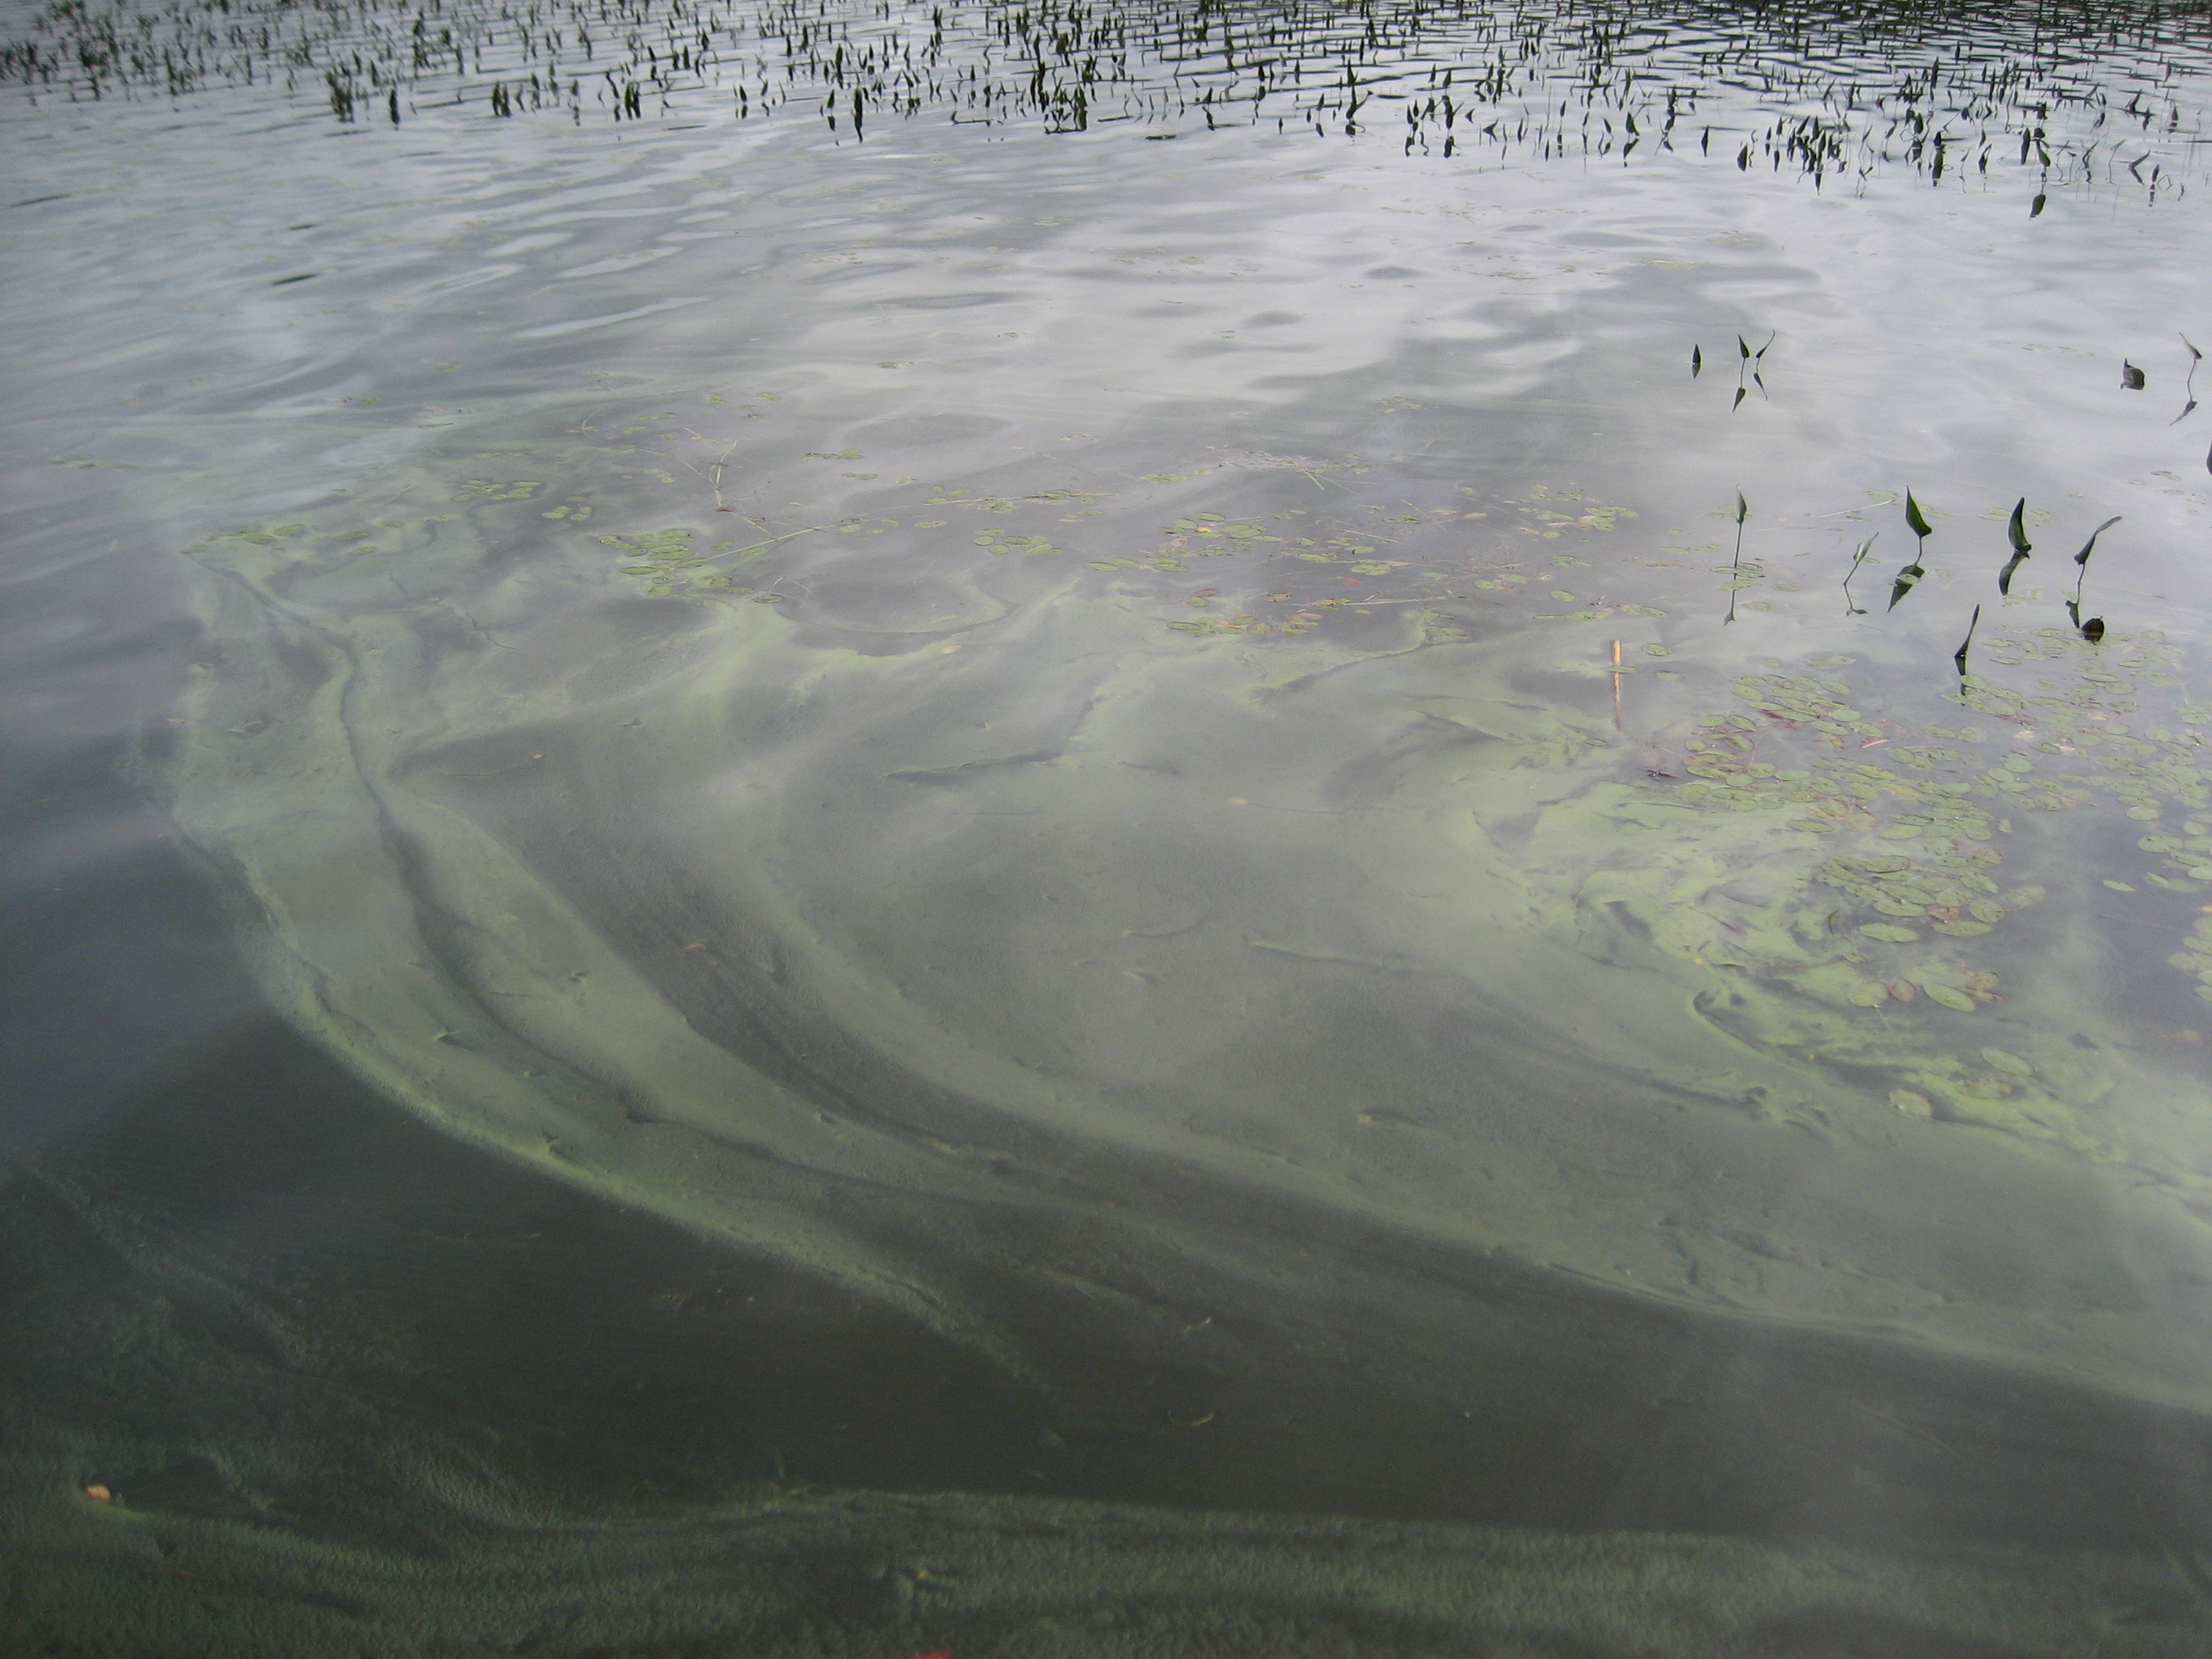
Province Lake experienced its first reported and confirmed cyanobacteria bloom since the 1970's in September 2010. Having had blooms 4 years in a row (2010-2013) means we are susceptible to having them in future years, especially in late summer, when at least 3 of the blooms occurred. When a cyanobacteria bloom is in progress (see description below), there is no way for us to know if it is toxic or not, so we need to act as if it is toxic. Therefore, it is important to know what a bloom looks like and act accordingly. If a cyanobacteria bloom is suspected, there may be Facebook postings and/or email alerts issued.
What a Cyanobacteria Bloom Looks Like: Large concentrations of cyanobacteria would be caused by a bloom, which would be seen as the formation of a green, blue, or pink surface scum in a section of the lake. Bear in mind that this is different from the tan or yellowish foam seen sometimes after strong winds. If present in large amounts, cyanobacteria can be toxic to animals and humans. While recreational exposure to cyanobacteria toxins is a major concern of NH DES, there have been no documented cases of cyanotoxin-related illnesses in New Hampshire. Photo by NH DES, courtesy of the PLA, 2012.
If you think you are seeing a cyanobacteria bloom, stay out of the water and especially, keep your children and pets out of the water. Call the NH DES Cyanobacteria Hotline at (603) 419-9229 to describe what you see. Click HERE to download the NH DES cyanobacteria flyer for more info. If suspicious, during "swim season" NH DES may sample and analyze the suspected bloom, then post a Lake Warning if there is any danger. They will monitor the situation and remove the postings when all is clear.
The best ways to avoid having cyanobacteria blooms are by eliminating fertilizer use on lawns, keeping the lake shore natural, protecting against shoreline erosion, and properly maintaining septic systems. The specific causes of our blooms is unknown, but preventing future blooms is a major goal of the Watershed Management Plan.
7. A pH between 6.5 to 7.0 is ideal for fish. pH is the measure of acidity, where 7.0 is neutral, below 7 is acidic, and above 7 is basic. During 2015, UNH measured pH two different ways, using a YSI Professional Plus multi-parameter meter (probe) to measure pH in the field immediately upon sampling, and a laboratory analysis of the bottled sample. The probe was only used twice during the relevant season, on 7/2 and 9/2/2015. Lab measurements were made 4 times for the Deep Spot (6/3, 7/2, 8/5, and 9/2/2015), 5 times for the Rt. 153 Inlet, and 6 times for the Island Inlet, so are probably more representative than the probe readings. The probe indicated an average pH of 7.06 in the upper layers and 7.03 in the lower layers. Lab measurements averaged 6.91 in both layers. All of the average respective pH's are significantly higher than those measured the prior year. In fact, the lower layer jumped from being the most acidic it has been in the 15 years (in 2014) it has been measured to being the least acidic in 16 years (in 2015). The upper layer about ties with the least acidic average readings over 25 years measured. The state average in the upper layers is 6.6.
Exceedances of the Water Quality Criteria for pH are defined as: pH < 6.5 or pH > 8.0. The state average pH of 6.6 is barely better than the 6.5 criterion, therefore a large number of New Hampshire water bodies are listed as "Slight impairment - marginal condition" in the "Aquatic life" use category for pH. Questions 4 and 4A of the 2012 supplemental report explain why Province Lake is listed as "Slight impairment - marginal condition" for pH and will probably stay listed for years.
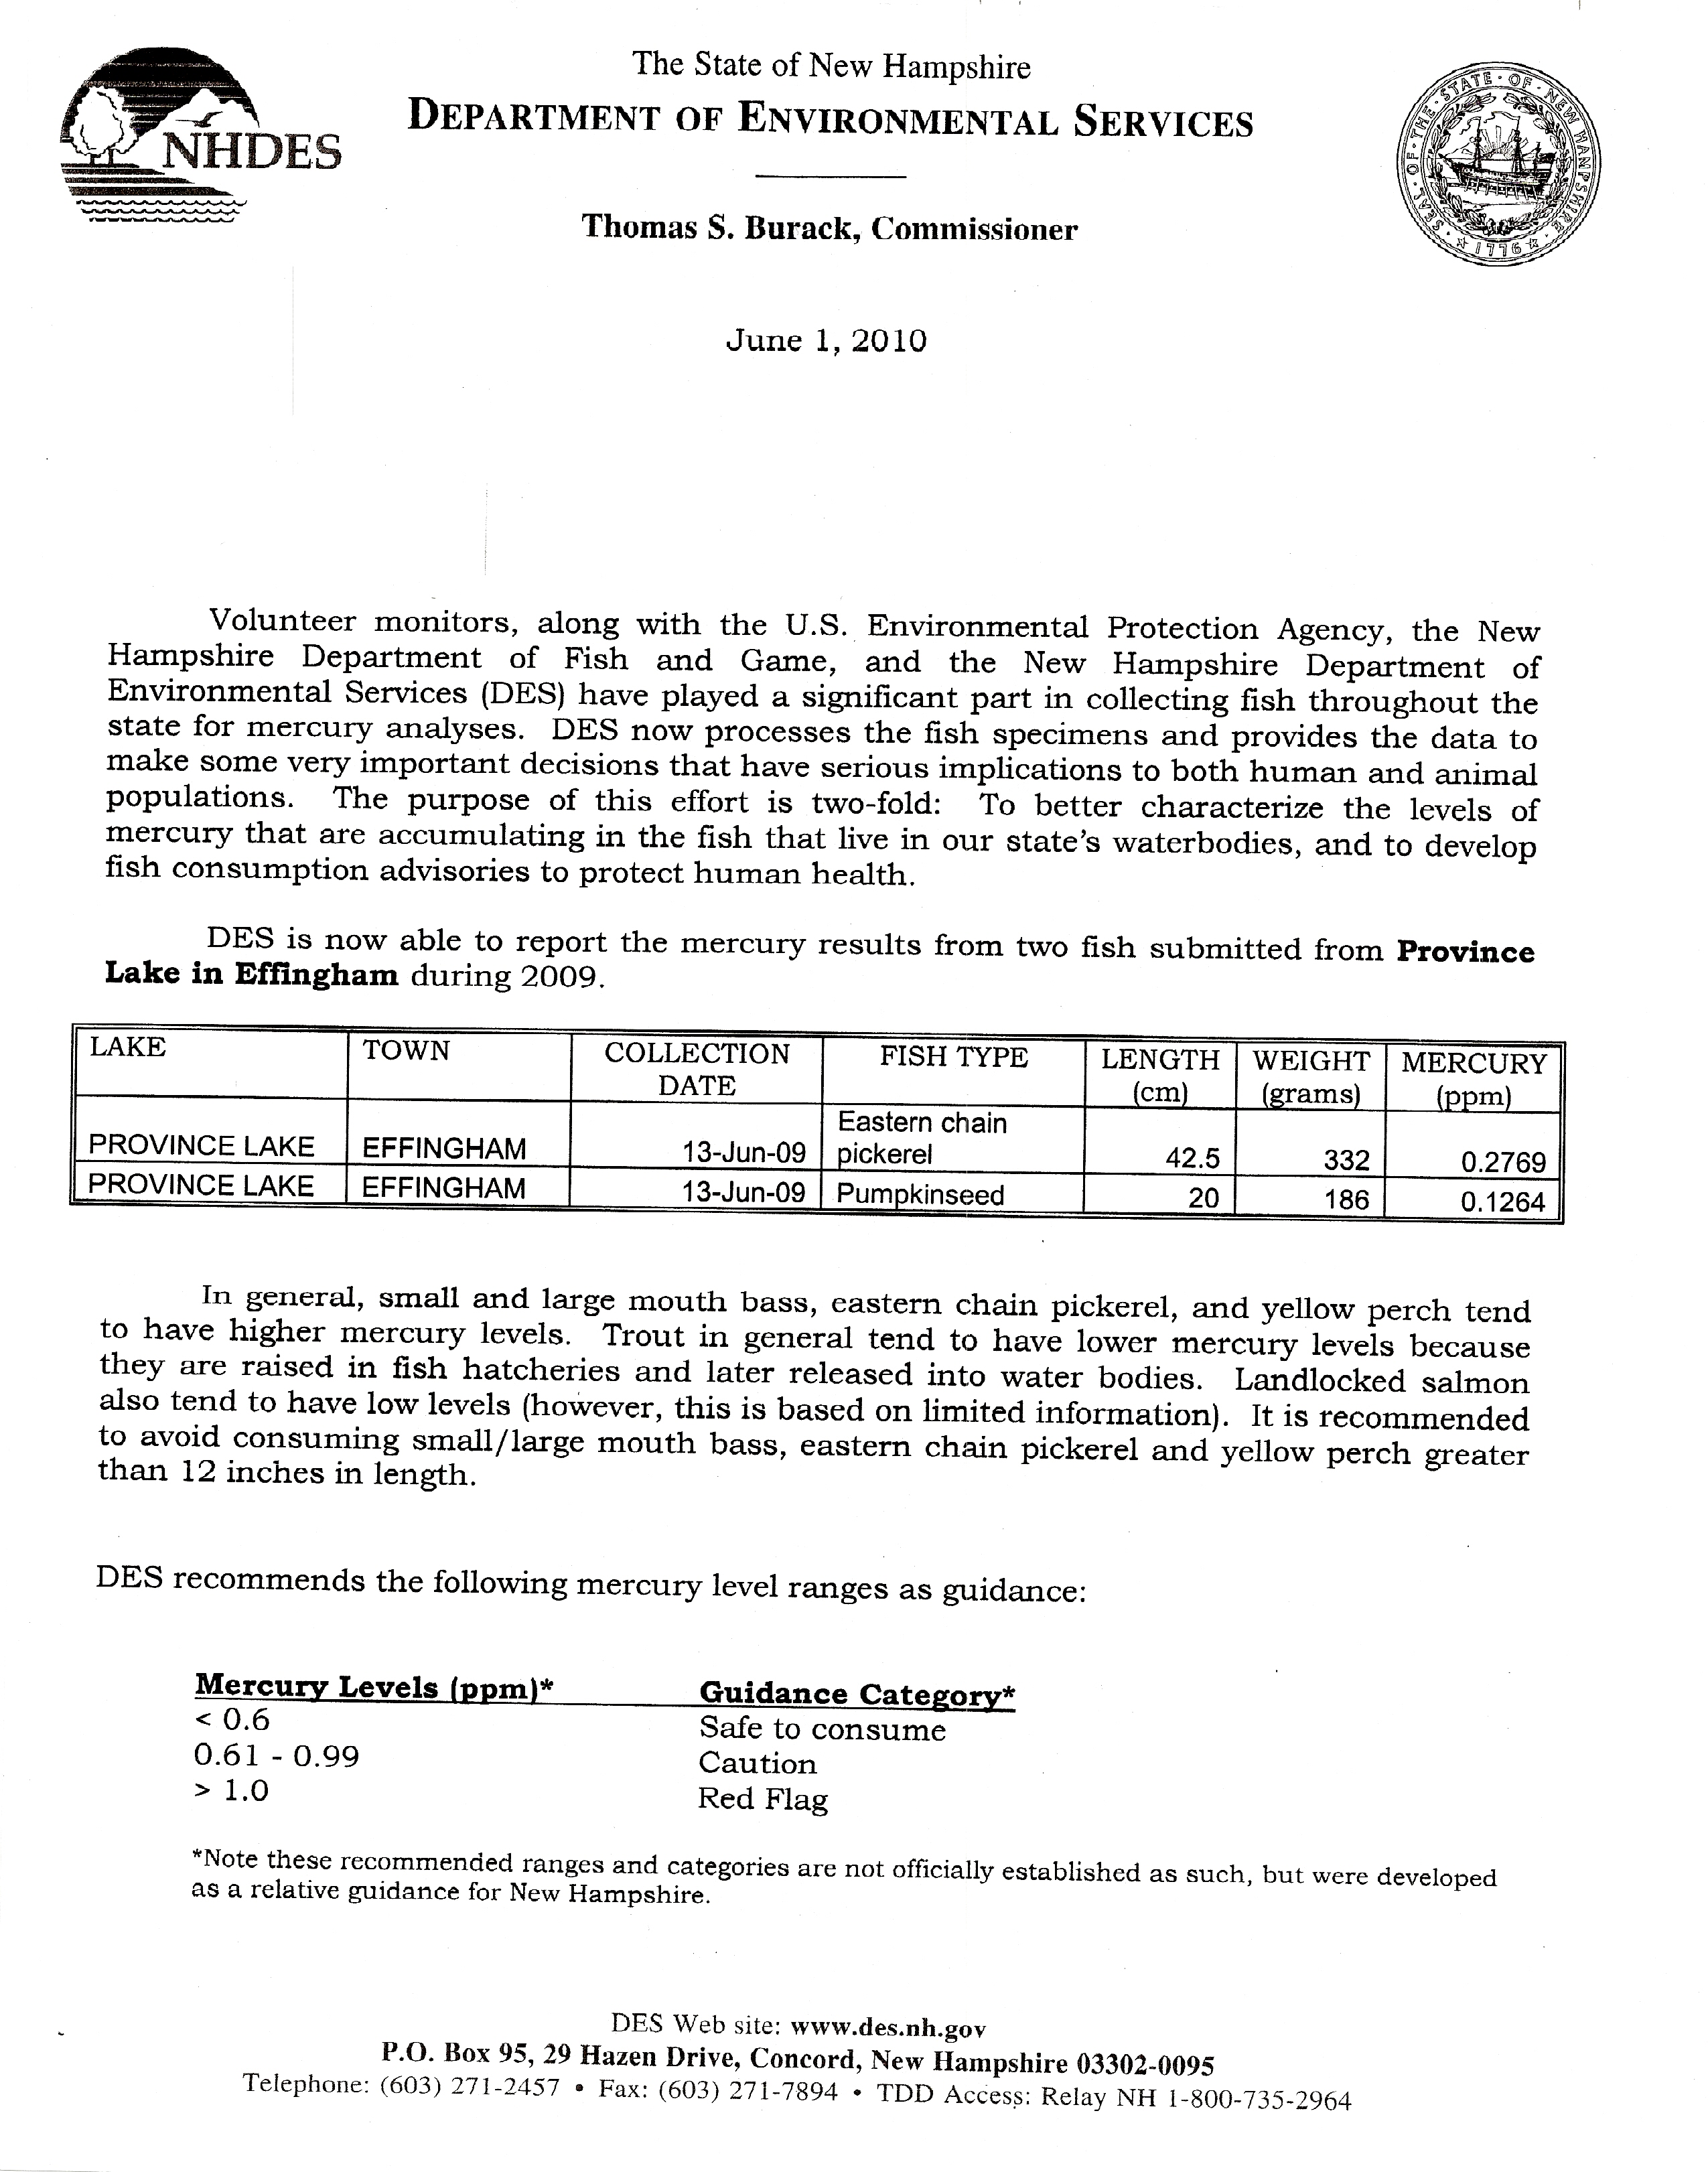
8. Province Lake was listed in 2008 as impaired for mercury in fish (3). Two fish from Province Lake tested in 2009 were shown to have safe mercury levels, but just two fish cannot be assumed to be sufficiently representative of all fish in the lake, especially since 7 years have passed since those fish were caught. It's better to be cautious and do catch-and-release, which makes for better fishing anyway, not to mention leaving food for the loons and bald eagles.
| Depth (meters) | DO (% saturation) |
|---|---|
| 0.1 | 93% |
| 0.5 | 93% |
| 1.0 | 93% |
| 1.5 | 93% |
| 2.0 | 92% |
| 2.5 | 92% |
| 3.0 | 92% |
| 3.5 | 91% |
| 4.0 | 90% |
| 4.5 | 88% |
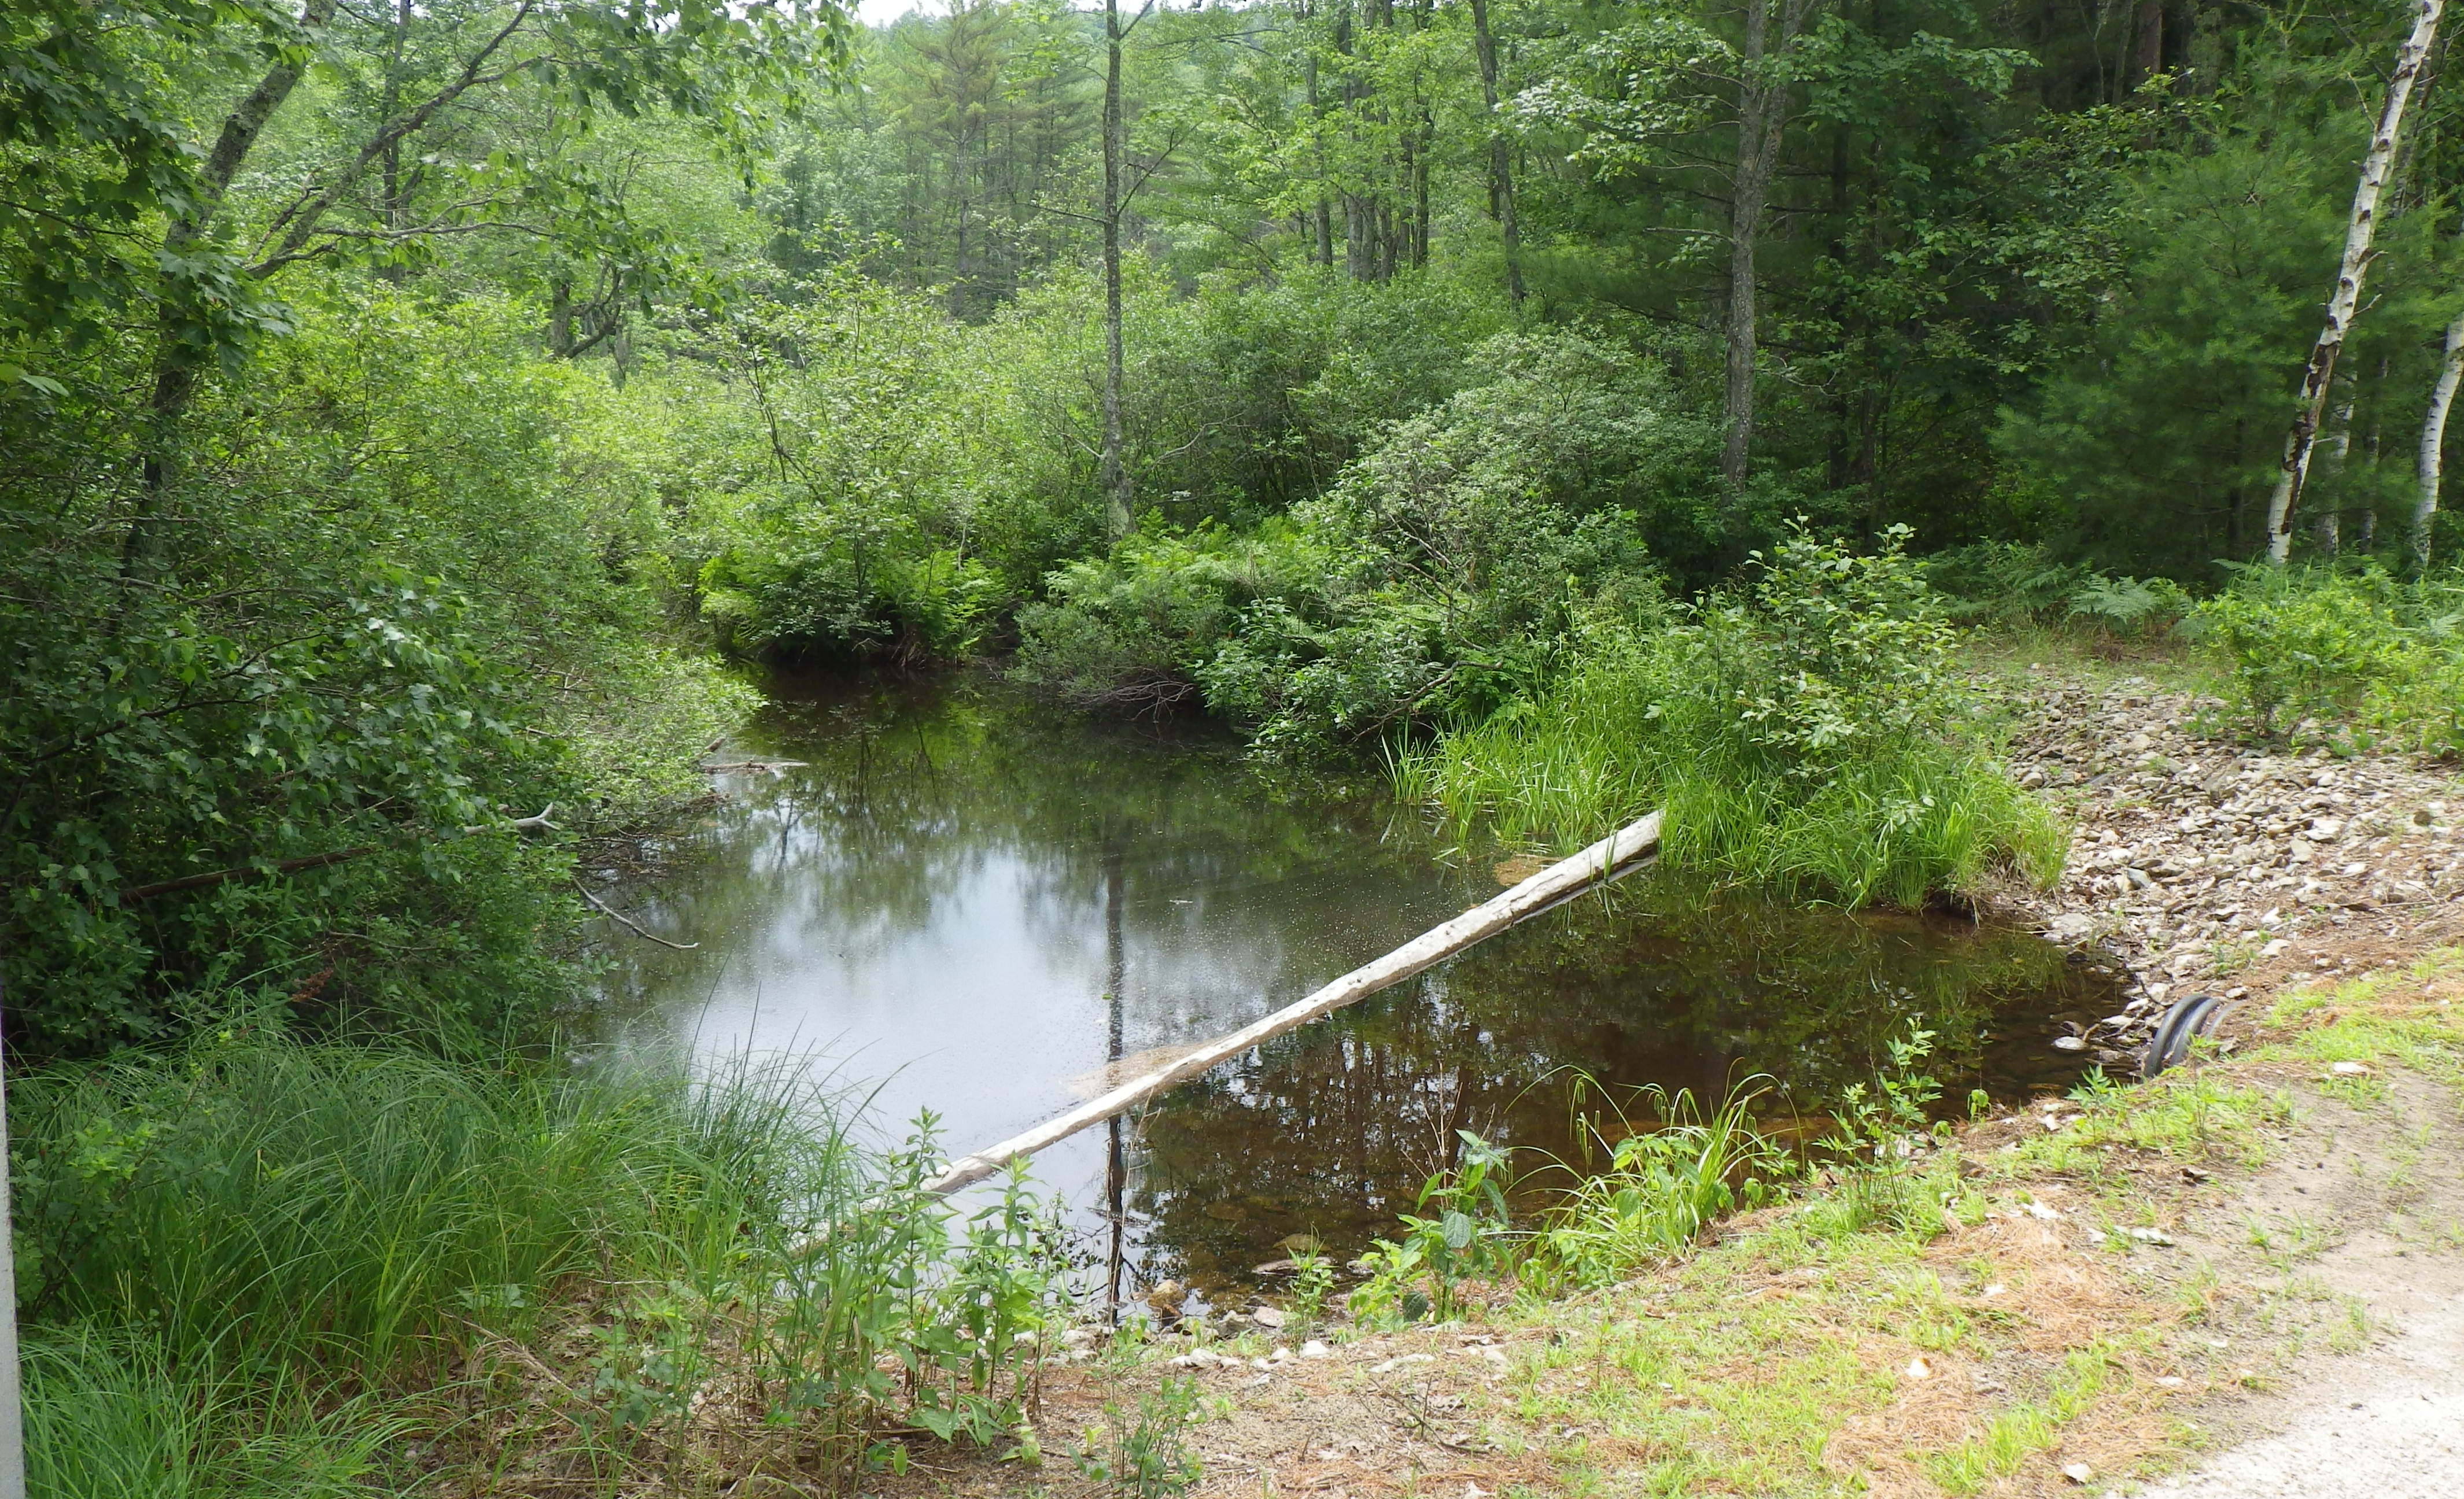
9. Thanks to the new UNH program, dissolved oxygen (DO) was measured 4 times (May - October), rather than once every 2 years under the latest VLAP schedule. The DO concentration measured in 2015 showed a high degree of saturation in the deep part of the lake. Averaging across all depths for all 6 months, the DO was at 92% saturation. The table displayed to the right provides the average saturation at each depth for the 4 measurements. There was no notable difference between the 2 readings taken during the June-Sept. period and the 2 taken outside that period. This detail of DO data was never available under VLAP, so there really is no past data to compare it to in any statistically meaningful way, except to say that generally, DO levels in Province Lake have been satisfactory. A high oxygen level is a sign of the lake's overall good health. I encourage powered watercraft to operate far from the shore to mix the deep waters and boost the oxygen concentration, while minimizing their operation in the shallows.
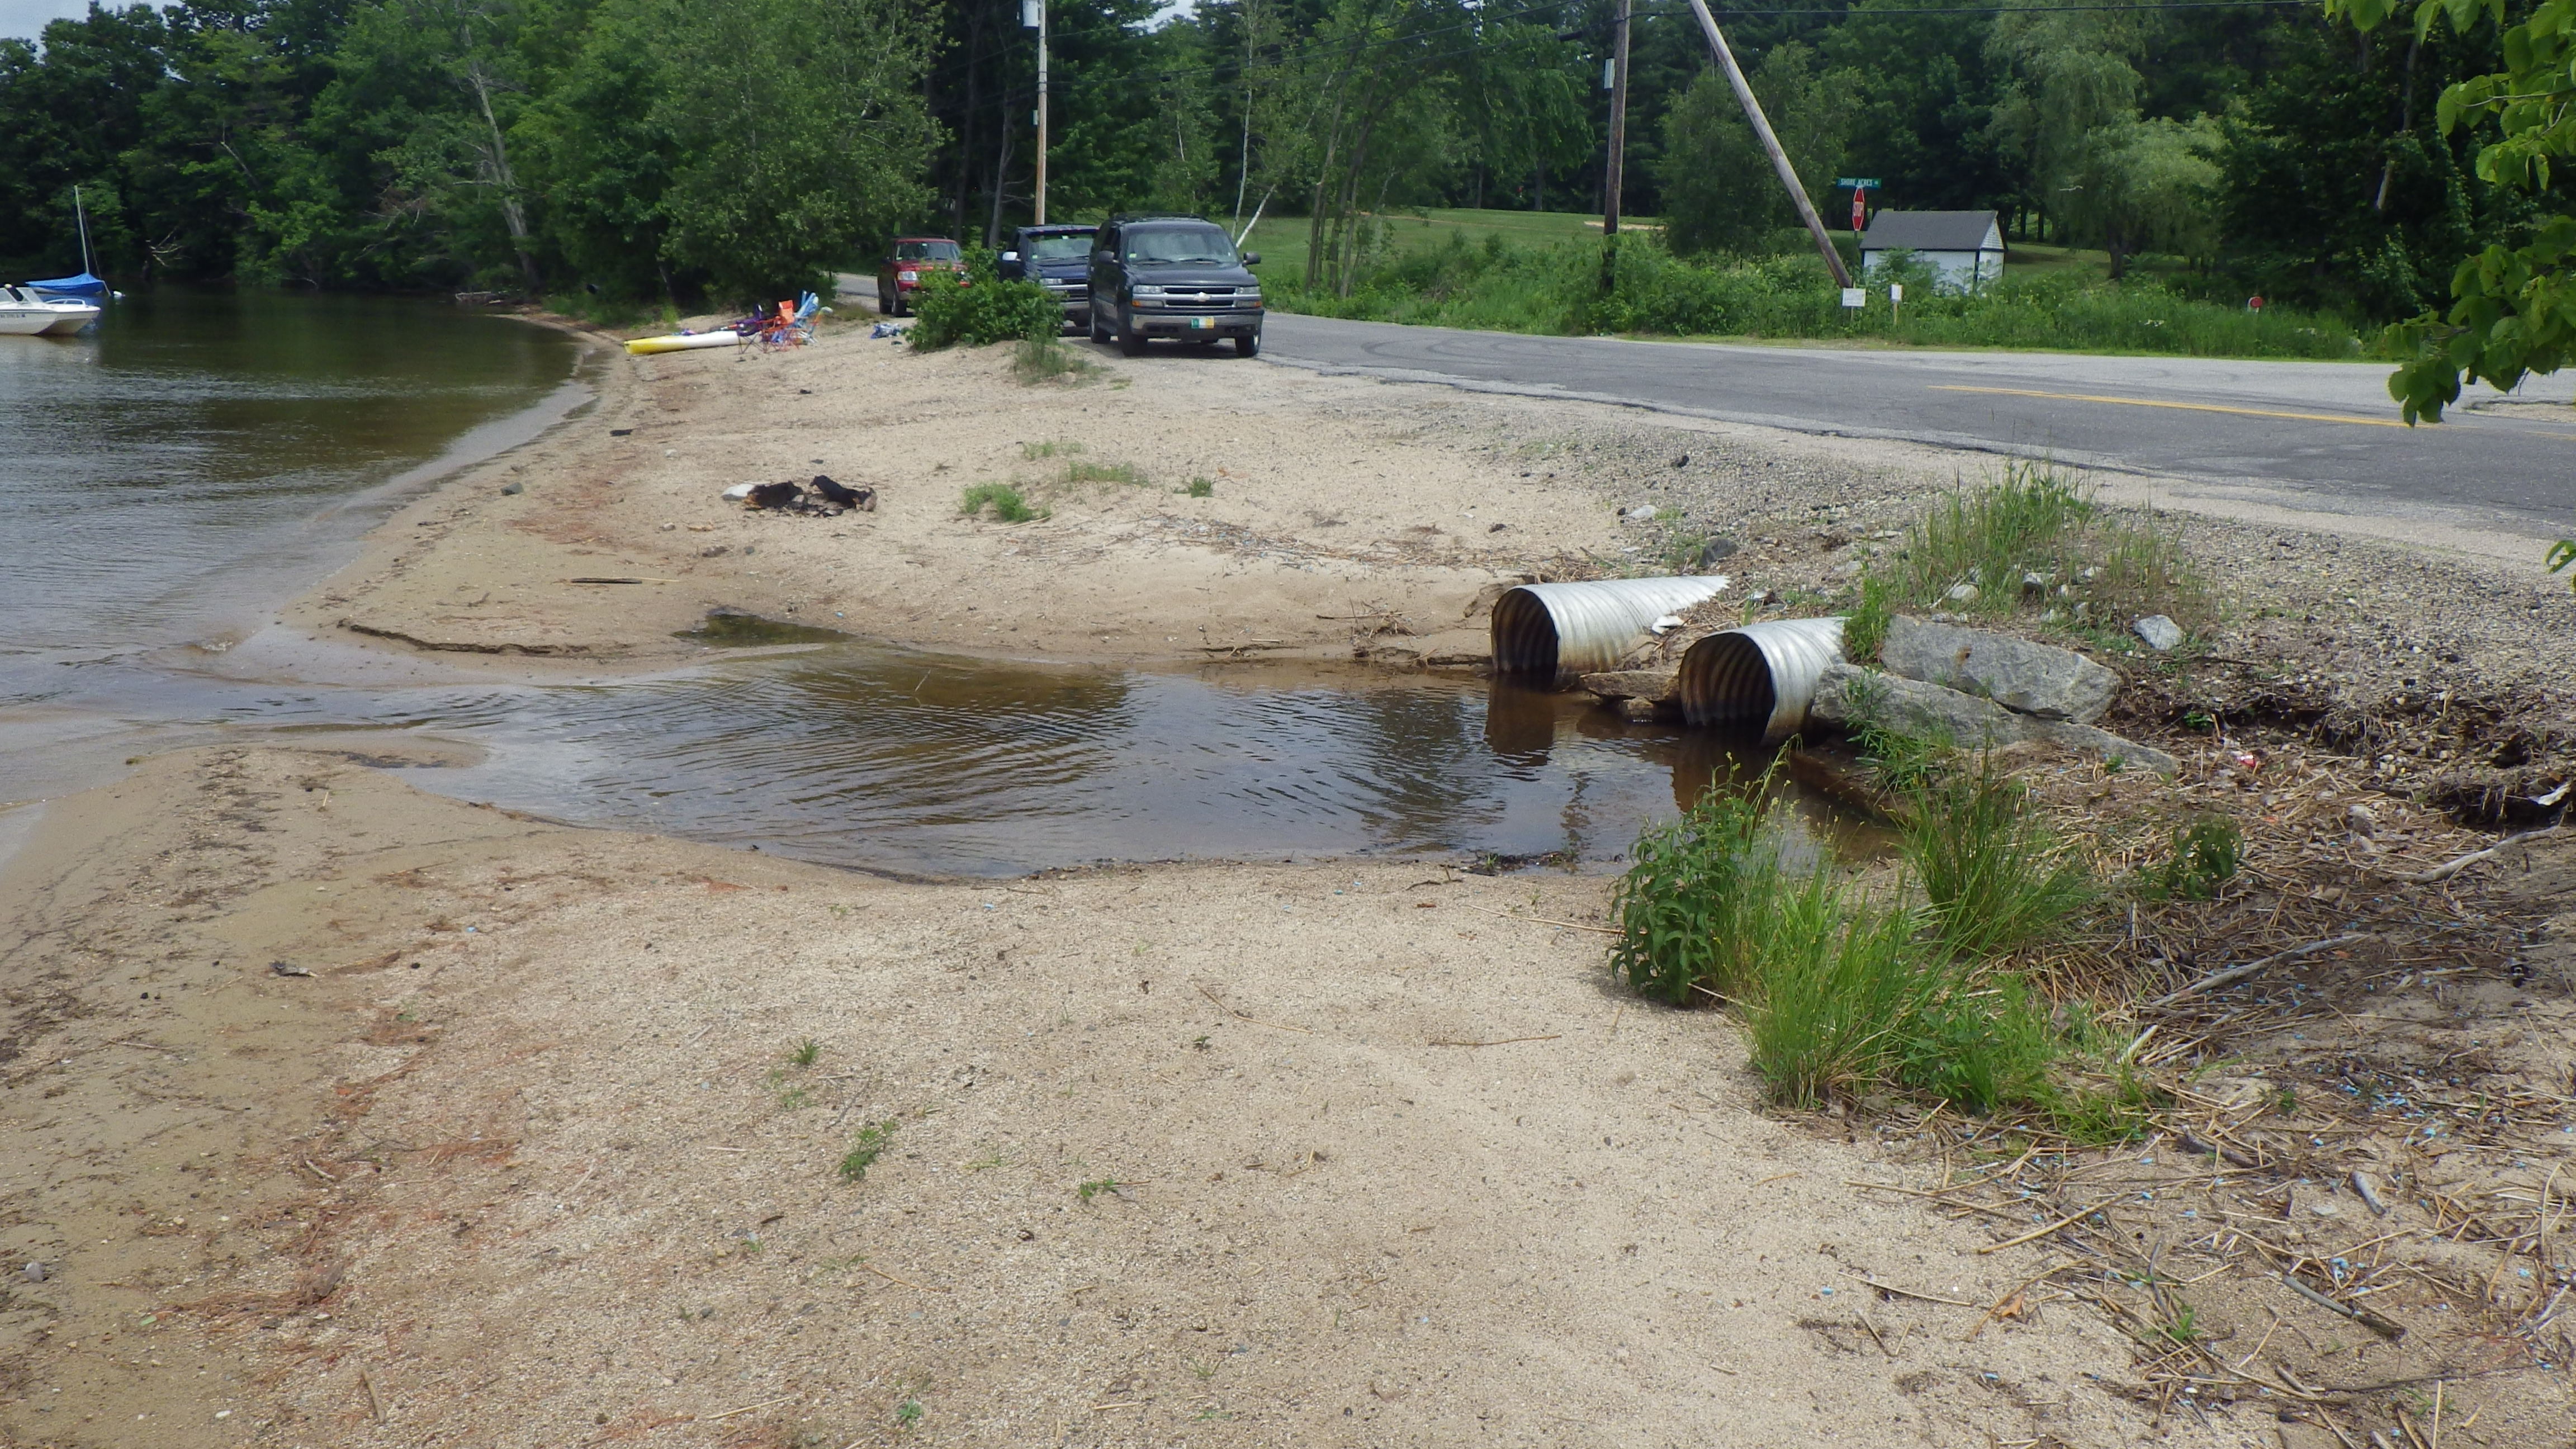
Even so, it only makes sense that everyone should still stay out of the stream that flows from the golf course and drains into Province Lake at the beach along Rt. 153 near Shore Acres Road in Maine, shown here. Click photo for wider angle. If it has been raining recently and you see that water is flowing into the lake at that location, it would be best to avoid swimming too close to it. There is no evidence that the golf course has done anything wrong. Wildlife are a likely source of the E. coli measured in 2013. Pass on this information to others. Generally, it is probably best to avoid swimming in any streams as they flow into the lake, since even those with E. coli levels considered safe had measurable amounts of bacteria in 2013. And it is always best to avoid swallowing lake water.
11. European water-starwort: Callitriche stagnalis, commonly known as either "pond water-starwort" or "European water-starwort", appeared in Province Lake during 2014. It is not native to Province Lake and is listed as "potentially or probably invasive" in Maine and some other states, although not yet in New Hampshire. Its dense weed bed is a threat to native plants that might otherwise grow in that spot, and is also an impediment to swimming in that area. Like any weed bed, it also creates habitat for leeches, which occur naturally in New Hampshire lakes. Leeches require unpolluted water, so their presence is actually a good sign, just not a sign we like to live with. There is an extensive detailed report about the appearance of C. stagnalis in Province Lake published on this web site. The size of the weed bed was measured in May 2016 (click photo at right) and will be added to the report, in accordance with the recommendation by experts to monitor the extent from year to year.
Reminders of Bigger Environmental Issues for Province Lake and Its Environs
Loons and Lead
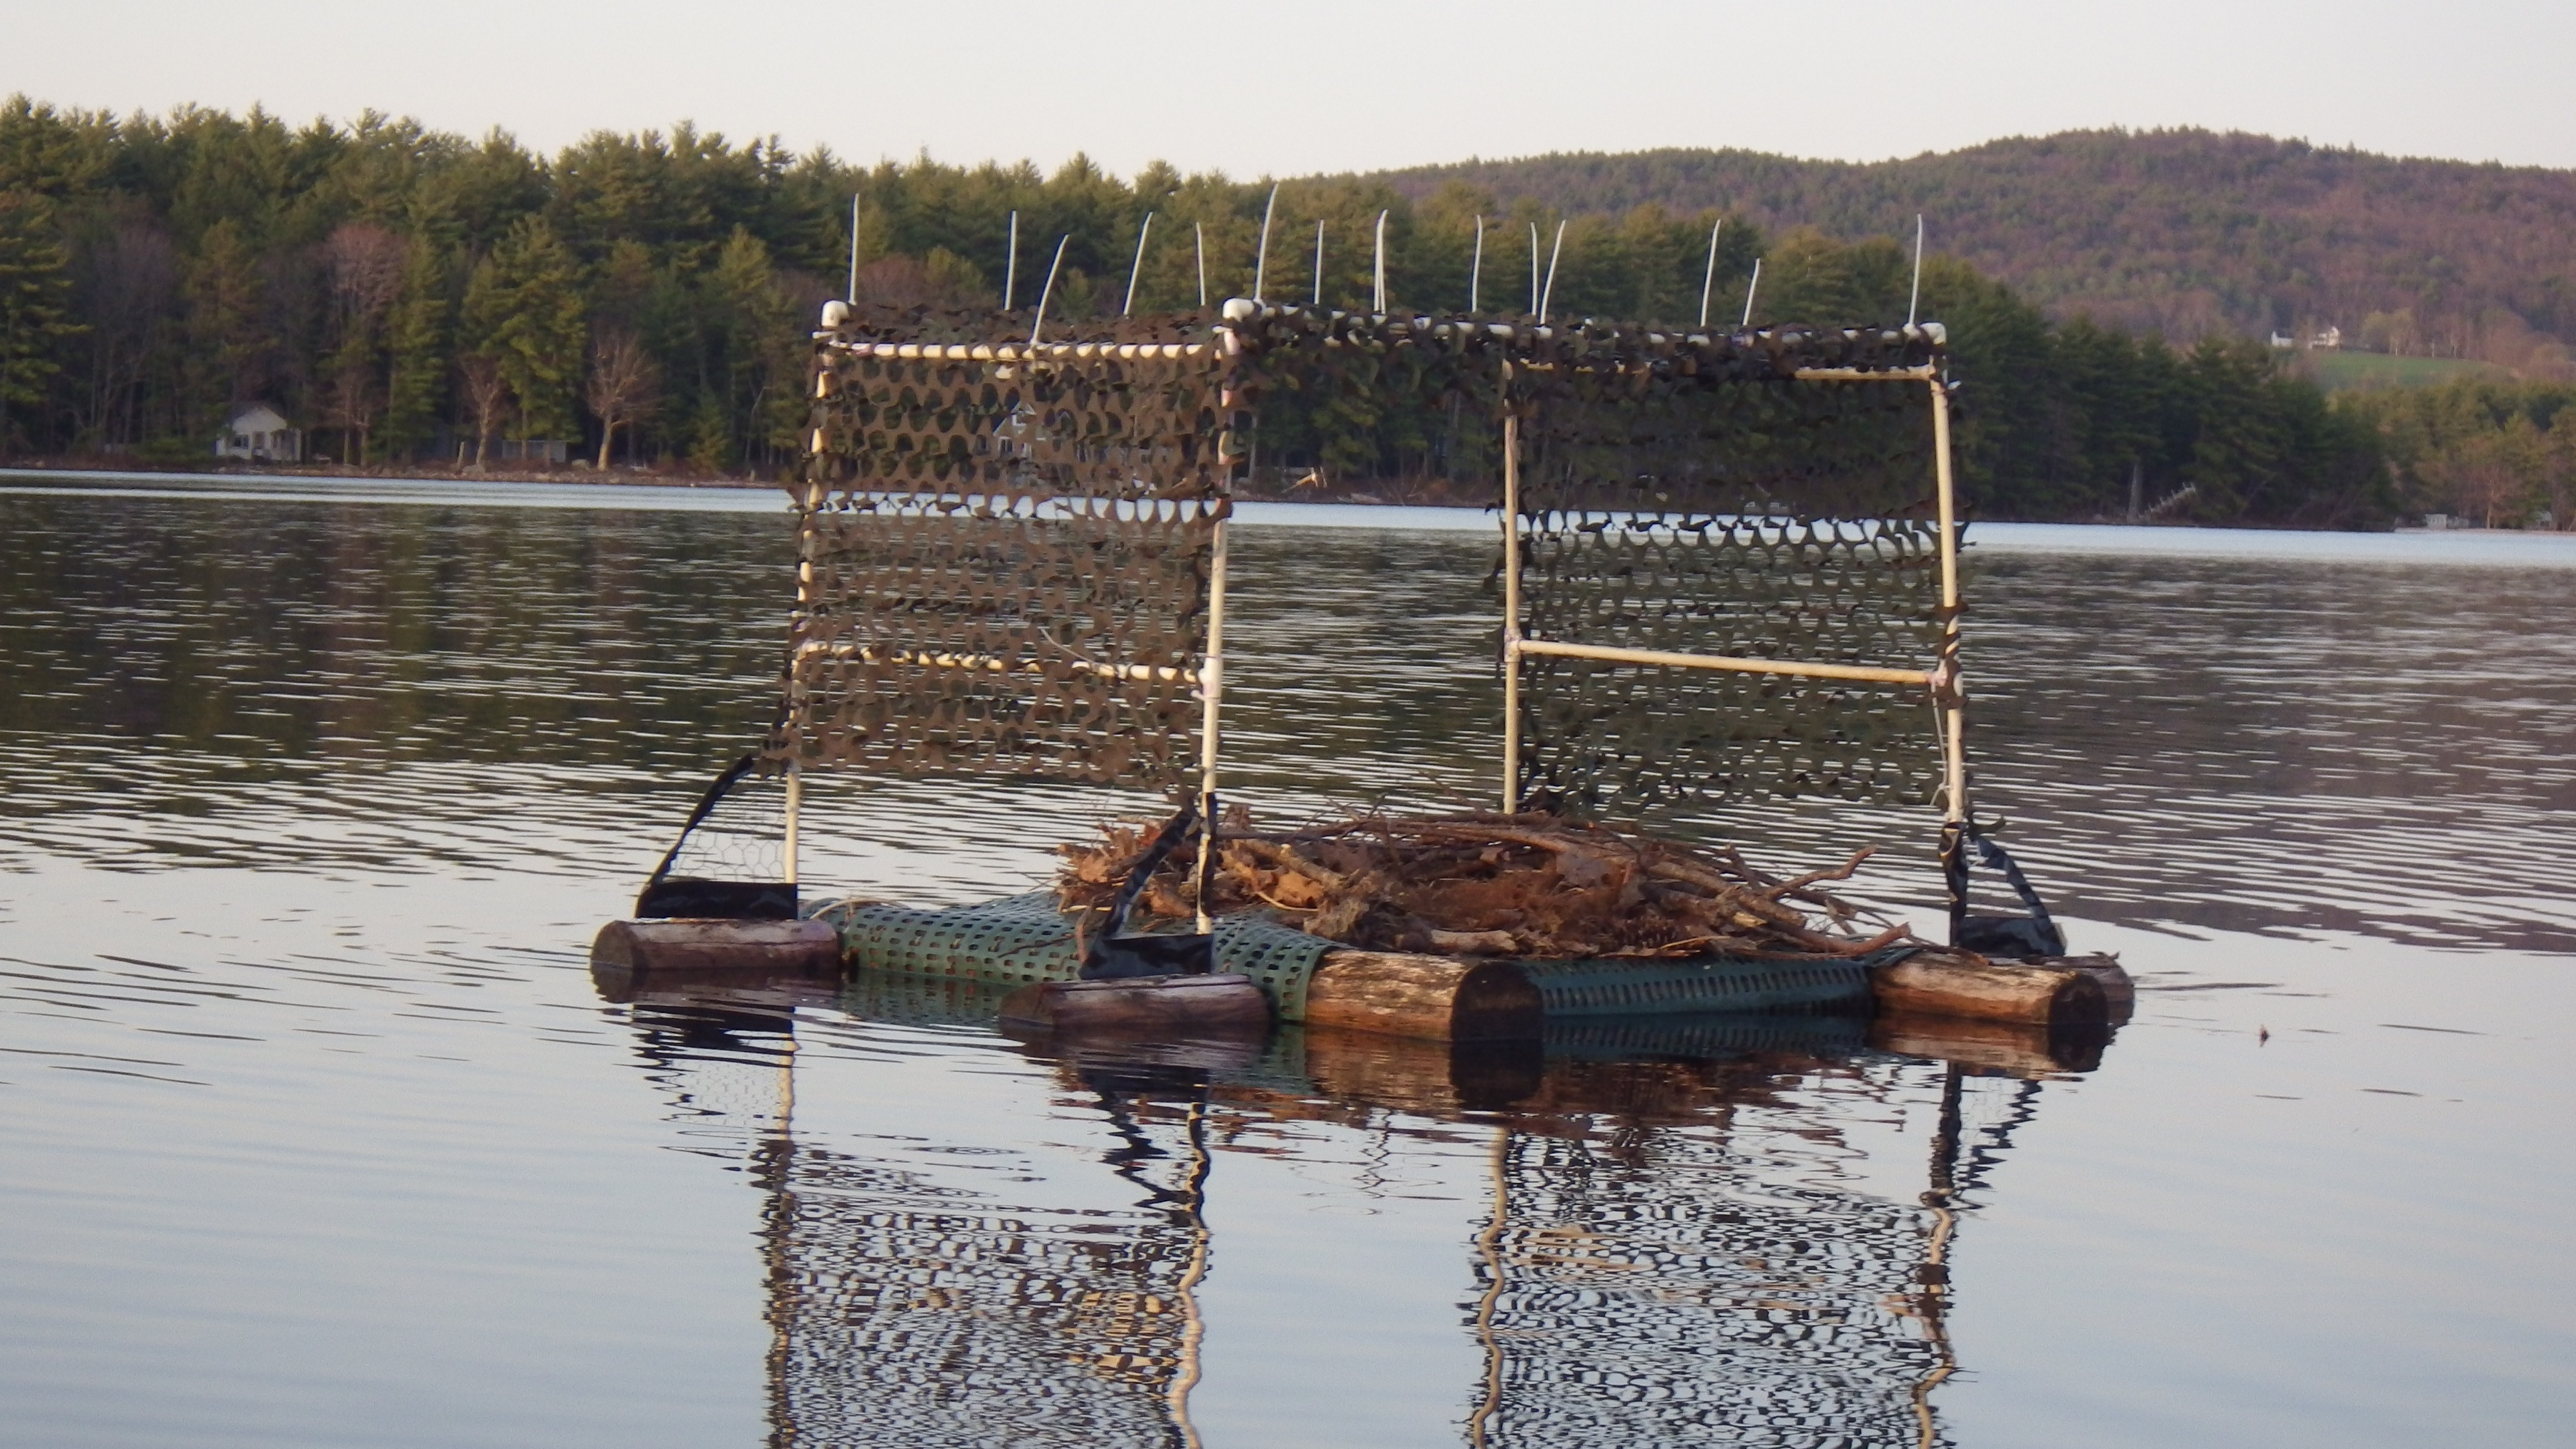
Most birds swallow small stones to help them digest food. Many fishing sinkers fall into the size range that loons prefer. Being fish-eaters, loons have a lower stomach pH than waterfowl that eat vegetation, such as geese and most ducks. The lower pH more effectively dissolves the lead, which then kills the bird. Poisoning from ingestion of lead objects has been identified as the #1 cause of loon deaths in fresh water. Therefore, most lead fishing sinkers have been outlawed so, if you still own any lead fishing gear, please stop using it immediately. For definitive and up to date information on this subject, please see the Loon Preservation Committee's Loons and Lead web page. This is a photo of the loon nesting raft on its day of installation in 2015, approached with the permission of Steve Craig.
Earthworms
If you bring up or buy earthworms to use as bait, you absolutely should not release them on the ground, since they are not native to New England and they can eat up the leaf litter and disturb the soil. Either use up your worms or give them to someone else who can use them. I had previously said you could dump them in the lake, as far from shore as you can, but both this article and a worm biologist I asked said that won't necessarily work, because earthworms can survive underwater and swim to shore. Some earthworms actually migrate to new territories by crawling into streams and taking a free ride downstream! Freezing for a few weeks or soaking in rubbing alcohol (isopropanol) probably work better. If you find euthanizing them in isopropanol to be too upsetting to watch, I have been told by the worm biologist that you can soak them in Epsom's salt solution first to relax them. Any soil you had the worms in can contain eggs or other life stages, so should be treated and not be dumped on the ground either. See the 2011 report for more details, including a video. The native plants, tree frogs, toads, salamanders, and other little creatures that live in the woods will thank you!
Polystyrene Foam in the Lake
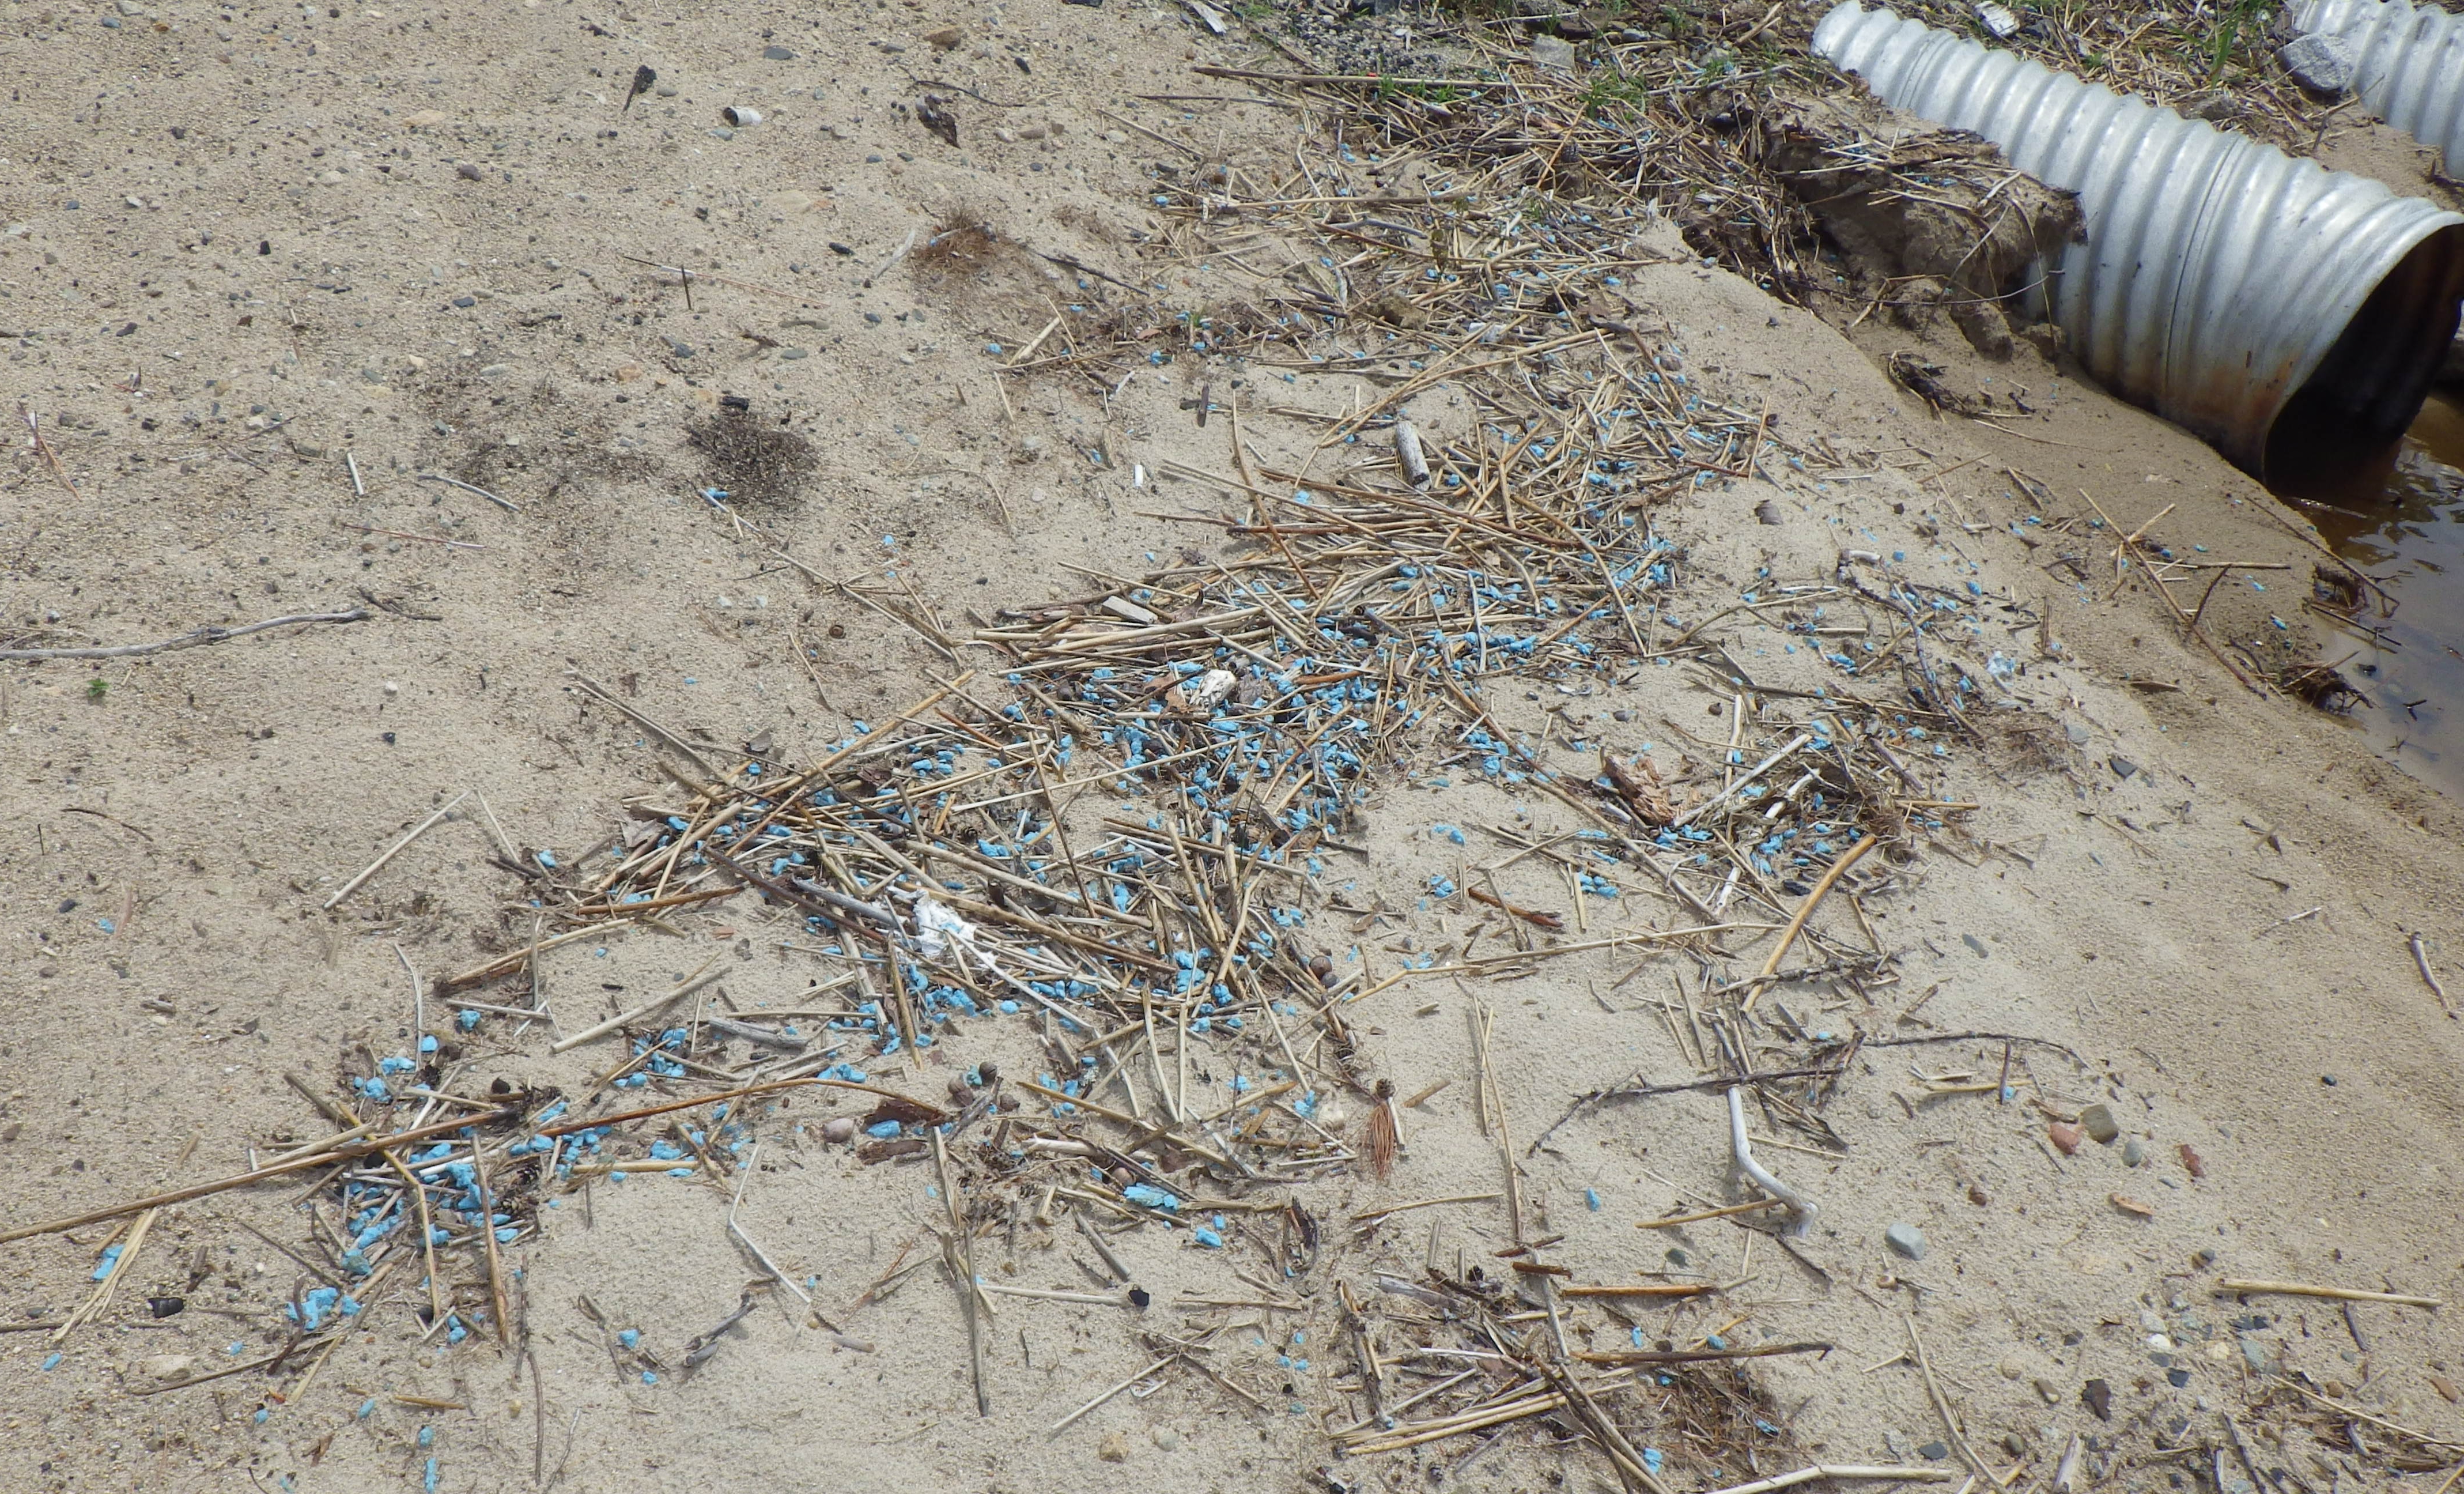

Polystyrene foam is a convenient product to provide flotation for swim rafts and for other purposes. Unfortunately, when exposed to ultraviolet (UV) radiation from sunlight, it can start degrading within months. Mechanical action from wave impacts can help to break it up once it has been weakened by UV. Whatever the means of degradation, polystyrene foam used in the lake is destined to break up and cause long-lasting plastic pollution. The foam physically breaks up into smaller and smaller pieces, but never really goes away. One of these photos shows blue polystyrene foam flakes washed up on the Maine section of beach along Rt. 153. The other shows a pail's worth of blue polystyrene foam flakes that came floating by my place October 17, 2013, when I just happened to be in the lake in my waders. I walked around in the weeds and gathered it all up, along with some other litter. It clearly had been released from one place nearby and had not dispersed widely yet. To protect the lake, the water downstream, and ultimately the ocean [click link for a great video], if you need flotation, it is better to use something that will not fall apart, such as plastic barrels or aluminum pontoons. If you are already using polystyrene foam, inspect it each year and dispose of it properly once it inevitably starts to degrade.
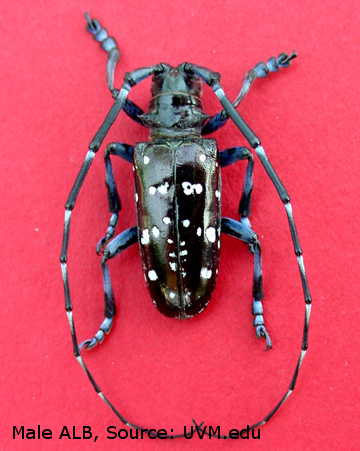
Asian Longhorned Beetle & Emerald Ash Borer


- NH Bugs - ALB Page
- Maine Department of Agriculture, Conservation and Forestry - ALB Page
- Massachusetts Introduced Pests Outreach Project - ALB Page

Online
I started the Province Lake Water Newsletter in 2013 to cover various topics related to water quality, invasive species, or other issues that have some bearing on the region surrounding Province Lake. I encourage you to sign up for these occasional emails HERE. You will receive a brief email you must respond to to confirm your free subscription. This feature keeps other people from signing you up. Signing up gets you the emailed newsletter only and your information will not be shared with anyone. You can easily unsubscribe or resubscribe at any time.
Last year's water quality summary report is posted HERE. That is the 2014 report, published online July 15, 2015.
There are now 193 members of the Facebook group called "Province Lake, New Hampshire & Maine", which is not affiliated with the any organization, but where people interested in the lake and nearby areas can share information. Province Shores Campground and Jolly Roger Village also have Facebook groups primarily for members, and there has been outreach regarding water quality issues by that means. These Facebook groups have been used to post cyanobacteria warnings, official or otherwise.
THANK YOU NOTE: I want to thank Steve Craig for taking the lead on the water sampling activity since 2004. Thank you to Steve, and others who have helped out from time to time! Steve can always use more volunteers to help him with sampling, etc. , so please contact me (at province-lake-water@cox.net ) if you are interested in helping out and I will pass on your information. If you are interested in becoming a Weed Watcher, I will also pass on your information if you contact me. The PLA currently coordinates and provides financial support to the sampling effort and weed watching on Province Lake. You do not need to be a member of the PLA to volunteer, and have no obligation to join if you do volunteer, although new or returned members are always welcome.
Thanks for your interest,
Norm Dudziak, P.E., I.M.
See Province Lake statistics HERE.
Footnotes
- The new watershed report card is based on the DRAFT 2014, 305(b) Report/303(d) List [relevant page here], issued 10/14/2015; the old one on the FINAL 2012, 305(b) Report/303(d) List [relevant page here], issued 7/16/2013. Listings are only issued every 2 years, so there is no 2015 update to the watershed report card either.
- While some still mistakenly use the term "algae" to refer to cyanobacteria, in this report "algae" is only used to refer to true algae. Cyanobacteria are bacteria, not algae. Other than both being microscopic cells, they are fundamentally different. See Footnote #2 of 2013 Newsletter #5 for a detailed explanation.
- Note 3 of the "Final- 2008 List of All Impaired or Threatened Waters" stated "all surface waters in New Hampshire are also included on this list due to statewide fish/shellfish consumption advisories because of mercury levels in fish/shellfish tissue." This issue is further explained in Question 1 of the 2012 Supplemental Report.
Legal Disclaimer: I am a degreed environmental engineer, licensed in Maine and other states, but my communications on this topic are educational in nature. Due to my professional engineering licenses, I am required to say that this communication does not constitute engineering work, even when using my engineering knowledge. I do not speak for anyone but myself, in the form of my company, E and I Services, LLC.
Terms of Use: Anyone is allowed, even encouraged, to link to this page. However, no one is authorized by the author
or by E and I Services, LLC
to copy the content and post it on another web site.
This web site is owned by E and I Services, LLC and has no affiliation with any other organization.
Copyright © 2016-2024 by E and I Services, LLC. All rights reserved.